Charts
Some useful charts here!
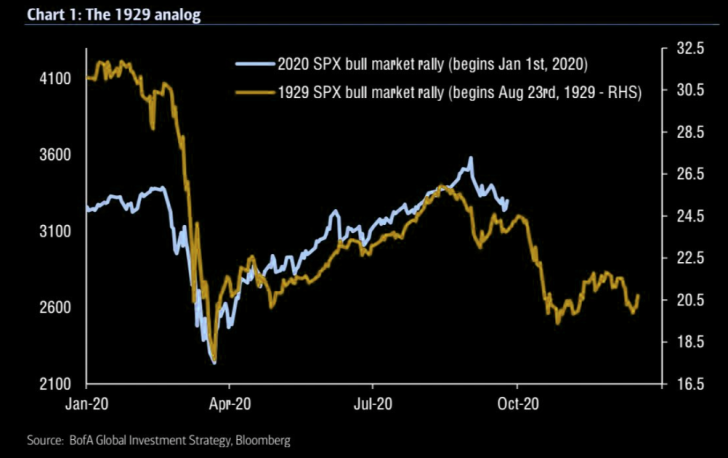
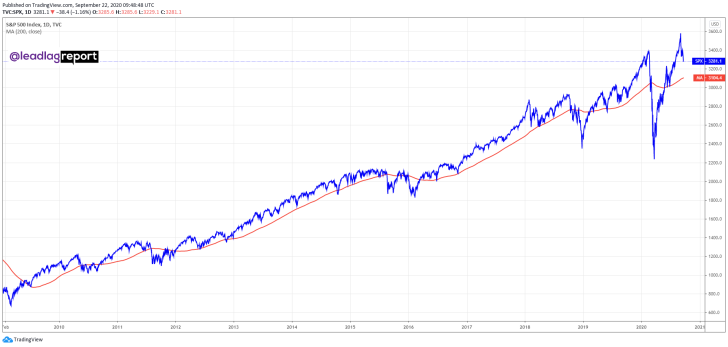
S&P 500 (SPX) Repeats the Trend observed in the times of the Great Depression
If history continues to repeat itself, the market will face another fall.
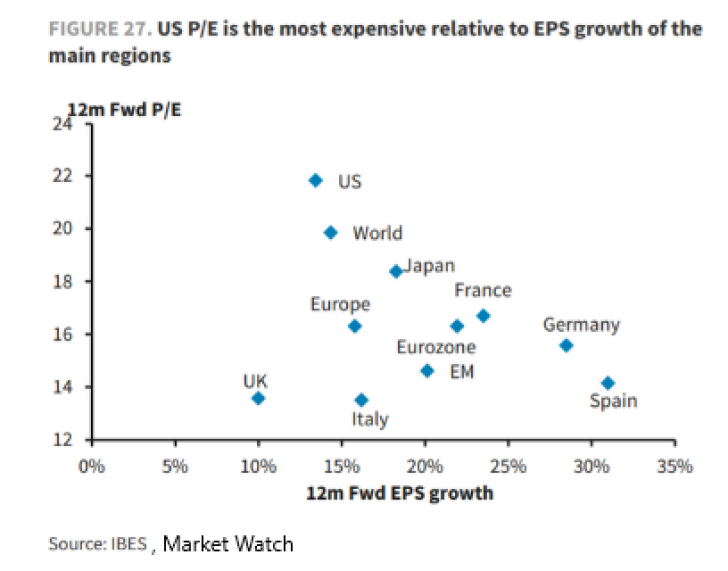
P/E Ratio of the US Market Is Still Very High, Even Despite Others Have Better EPS Over Time
European and Asian markets offer better EPS over time, but investors stick with the US.
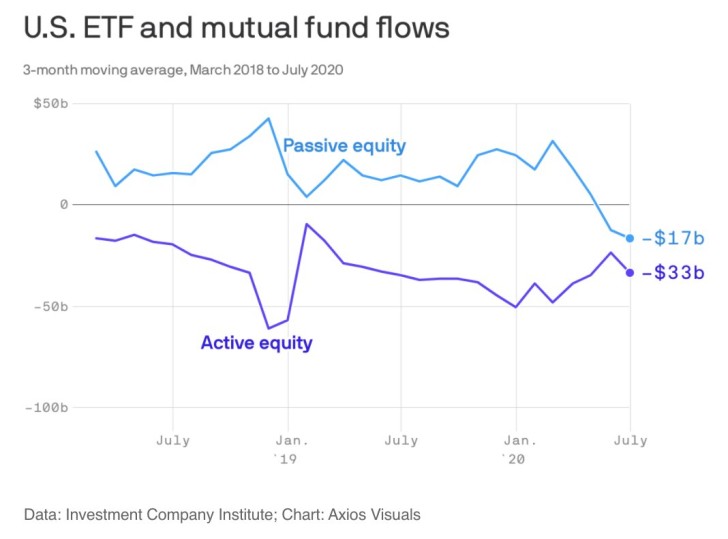
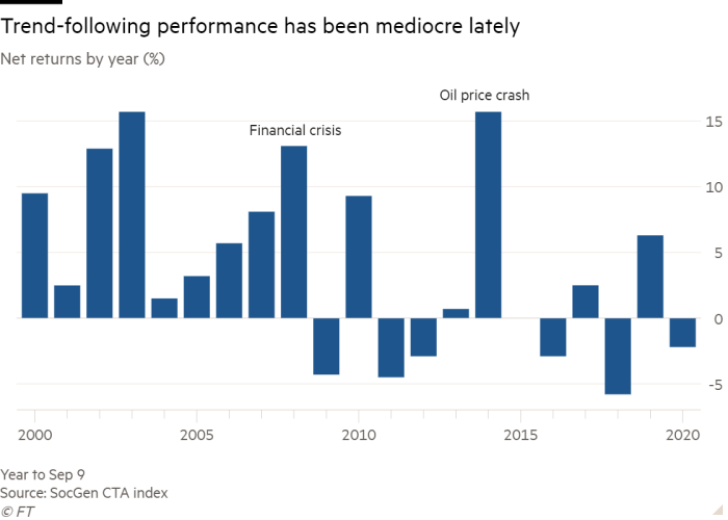
Index-Following Hedge Funds Struggled this Year Due to High Volatility and Instability
In times of spikes and high market volatility, passive hedge funds do poorly.
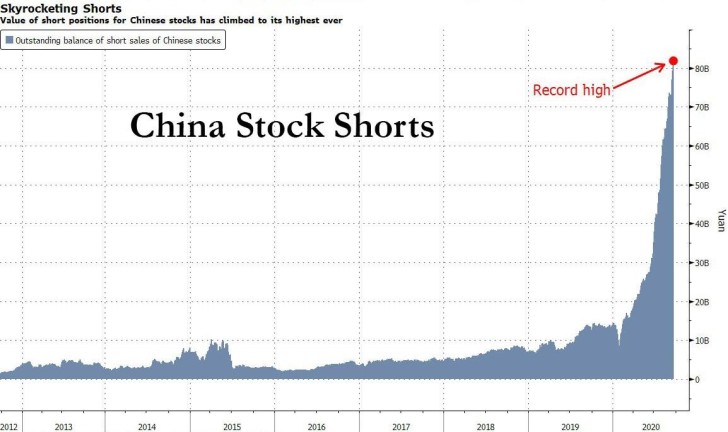
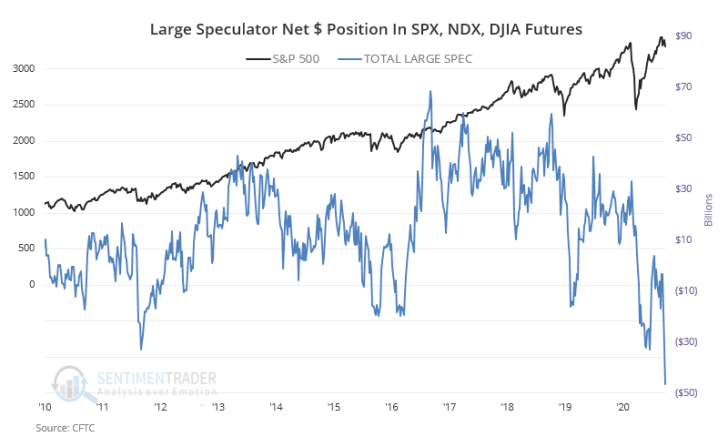
S&P 500 (SPX) Correction Triggered the Short Positions’ Increase to $47 Billion by Large Speculators
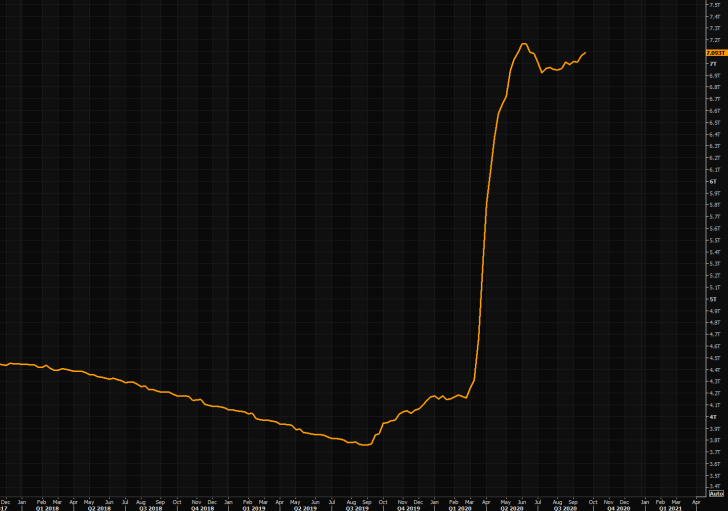
Federal Reserve's Balance Sheet Is Now More than $7 Trillion after an Enormous One-Quarter Growth
The highest spike ever due to the Fed's anti-crisis measures.
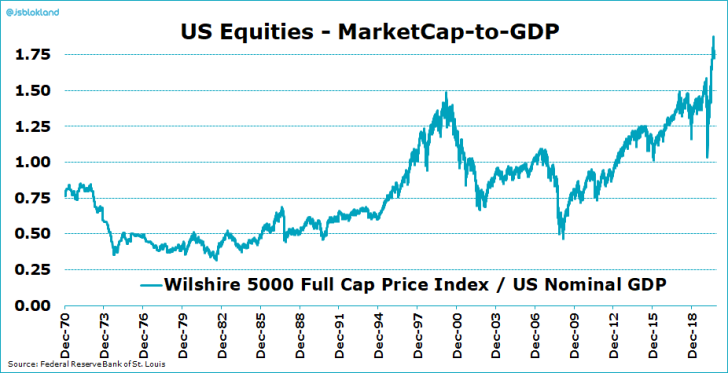
Wilshire 5000's (W5000) Total Capitalization Is More than 175% of the US GDP for the First Time Ever
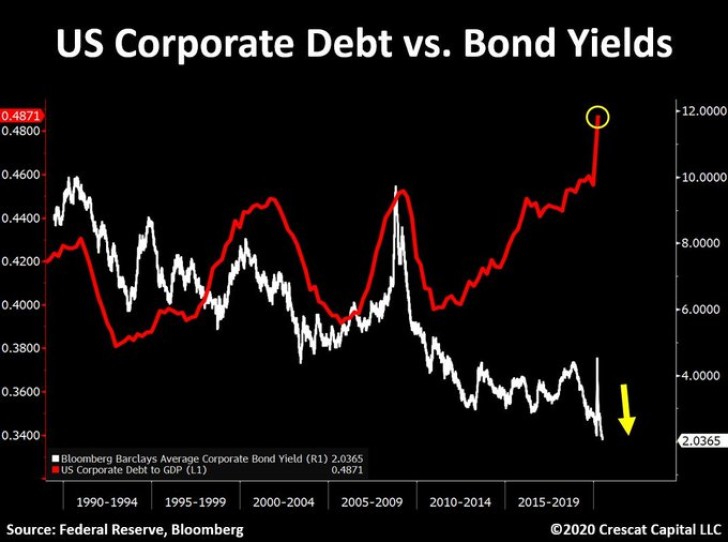
The Biggest Gap between the Amount of Corporate Debt and Bond Yields
The Federal Reserve is creating a monster on the debt market.
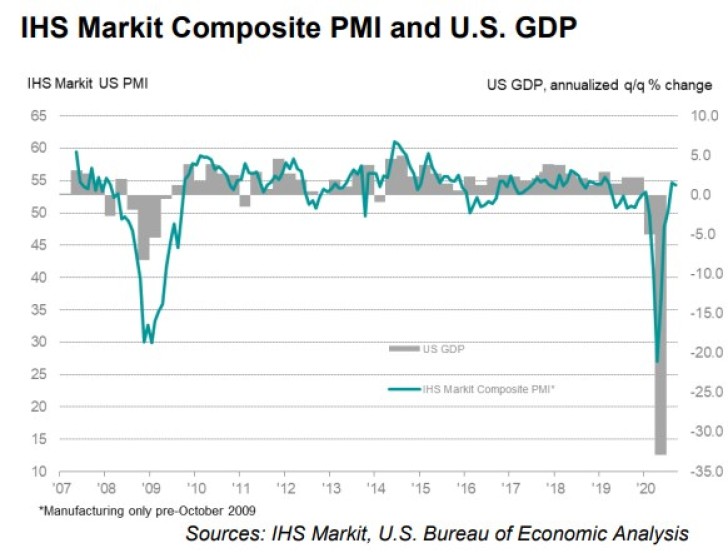
IHS Markit Flash U.S. Composite PMI
The business activity index is recovering, which may have positive future prospects.
 Usman Salis
 Peter Smith
 Saad Ullah
 Alex Dudov
 Sergey Diakov
 Eseandre Mordi
