The S&P 500 Will Fall Even Deeper if the Correction Repeats the Same Trend
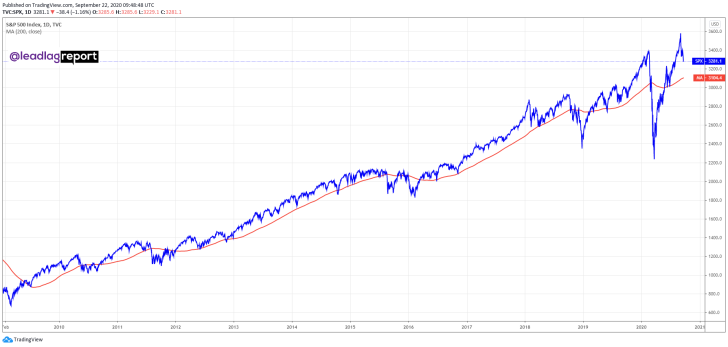
Michael A. Gayed notes that since 2009, during most of the corrections, the S&P 500 has fallen below the 200-day simple moving average line.
If the current correction, which began on September 2, develops according to the same scenario, then the index is expected to fall below 3104 pt. At the moment, the S&P 500 is 3,298 pt.

What Is a Simple Moving Average?
A simple moving average is a simple technical analysis indicator popular among traders. It is calculated as the average value of the index over a certain period, in the case of a 200-day SMA it is equal to 200 previous trading days.
A simple moving average smooths out volatility and makes it easier to view the price trend. In this case, the SMA line is an important resistance or support level, depending on the position relative to the current value of the asset.
 Sergey Diakov

 Sergey Diakov


