 Marina Lyubimova
XRP (XRP/USDT) is trading at $2.2135, showing signs of tightening price action within a clearly defined symmetrical triangle on the weekly chart. Pressure is mounting as XRP approaches the triangle’s apex, raising expectations of a decisive breakout — or breakdown.
Triangle Pattern Squeeze: Pressure Builds
The chart highlights a multi-week consolidation with XRP holding the key support at $2.00 “like a champ.” The price is coiling between converging trendlines, forming a textbook symmetrical triangle. No breakout has occurred yet, but the structure indicates that a significant move is likely approaching.
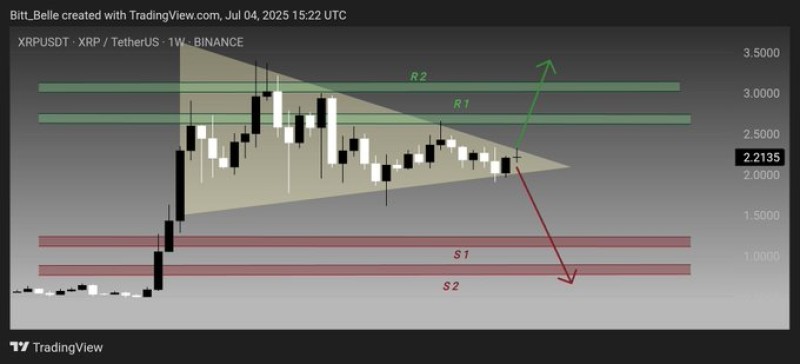
A sustained push above $2.40 — marked as resistance zone R1 — would confirm a bullish breakout, potentially opening the path toward the R2 target near $3.20.
Downside Risk: Support Zones to Watch
If XRP fails to hold the $2.00 psychological and technical support, the breakdown scenario could unfold. The first critical support zone is S1 at approximately $1.50, followed by S2 near the $1.00 mark. The structure suggests that failure to maintain the triangle’s lower boundary could result in sharp downside acceleration.
Conclusion
XRP is approaching a key technical inflection point, with both bulls and bears eyeing the breakout from this tightening formation. A move above $2.40 could spark momentum toward $3.20, while a loss of $2.00 may trigger a deeper retracement. As the pattern compresses, traders should stay alert for a decisive move in either direction.
 Marina Lyubimova


