 Saad Ullah

AMD is approaching a technically significant level as price pushes higher into resistance. The Rock Trading Group noted that a move above $221 would place the stock into an earnings gap - a setup that often leads to accelerated price movement if confirmed.
The $221.58 Level That Defines the Move
The chart highlights a clear resistance level near $221.58, which stands as the immediate barrier for AMD.
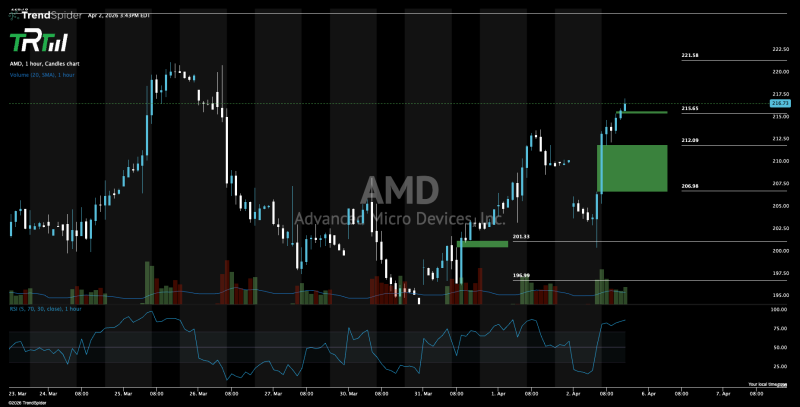
Price is currently trading just below this zone, hovering around the mid-$210s after a strong upward move. This positioning suggests the market is testing resistance rather than rejecting it outright.
A move above $221 places AMD directly into an earnings gap - a zone with relatively little recent trading activity where price can travel faster due to reduced overhead resistance.
The importance of this level is reinforced by broader AMD technical analysis, where the $221 zone has repeatedly been identified as a critical resistance threshold that needs to be cleared for momentum to shift higher.
A Recovery That Brought AMD Price Back to Resistance
Before reaching this level, AMD experienced a decline toward the $197-$200 area, followed by a sharp rebound.
The chart shows price moving higher from that base, forming a sequence of higher lows and pushing back into resistance. This type of recovery suggests improving short-term momentum - but not yet a confirmed breakout.
The structure shows price consolidating just below resistance, which points to a pause rather than a reversal. That distinction matters when evaluating whether the next move is a continuation or a fade.
Price is now consolidating just below resistance, indicating a pause rather than a reversal. Similar behavior was observed in AMD's recent technical structure, where stabilization near key levels preceded continuation attempts.
What Changes Above the AMD Breakout
When price moves into an earnings gap zone, it can travel faster due to reduced overhead resistance. This is the core of the current setup - not just that $221 is resistance, but that what lies above it is relatively open space.
Above $221, the structure shifts from compression into potential expansion. That's where breakouts tend to accelerate rather than grind.
A confirmed move above $221 would shift the structure into continuation, potentially accelerating price into higher levels. If the breakout fails, AMD may remain below resistance and continue consolidating within the current range.
The Setup Now Comes Down to Confirmation
At this stage, the structure is defined by proximity to resistance rather than a completed breakout:
- Price is pressing into the $221 level
- No clear rejection has formed yet
- Momentum has improved from recent lows
- The next move depends on whether resistance breaks
Similar breakout conditions have been outlined in AMD's Elliott Wave analysis, where continuation patterns depend on clearing key resistance zones before momentum expands toward the $260 target.
AMD stock now sits at a technically precise level - where the difference between rejection and breakout will determine whether the next move unfolds slowly or accelerates quickly.
 Saad Ullah


