 Eseandre Mordi

⬤ AMD stock is finding stability around $213 after pulling back from higher levels. The daily chart shows the shares trying to establish a base following weeks of selling pressure, with momentum starting to ease. The $221 level has emerged as a key resistance zone that would need to be broken to shift the technical picture back in favor of buyers.
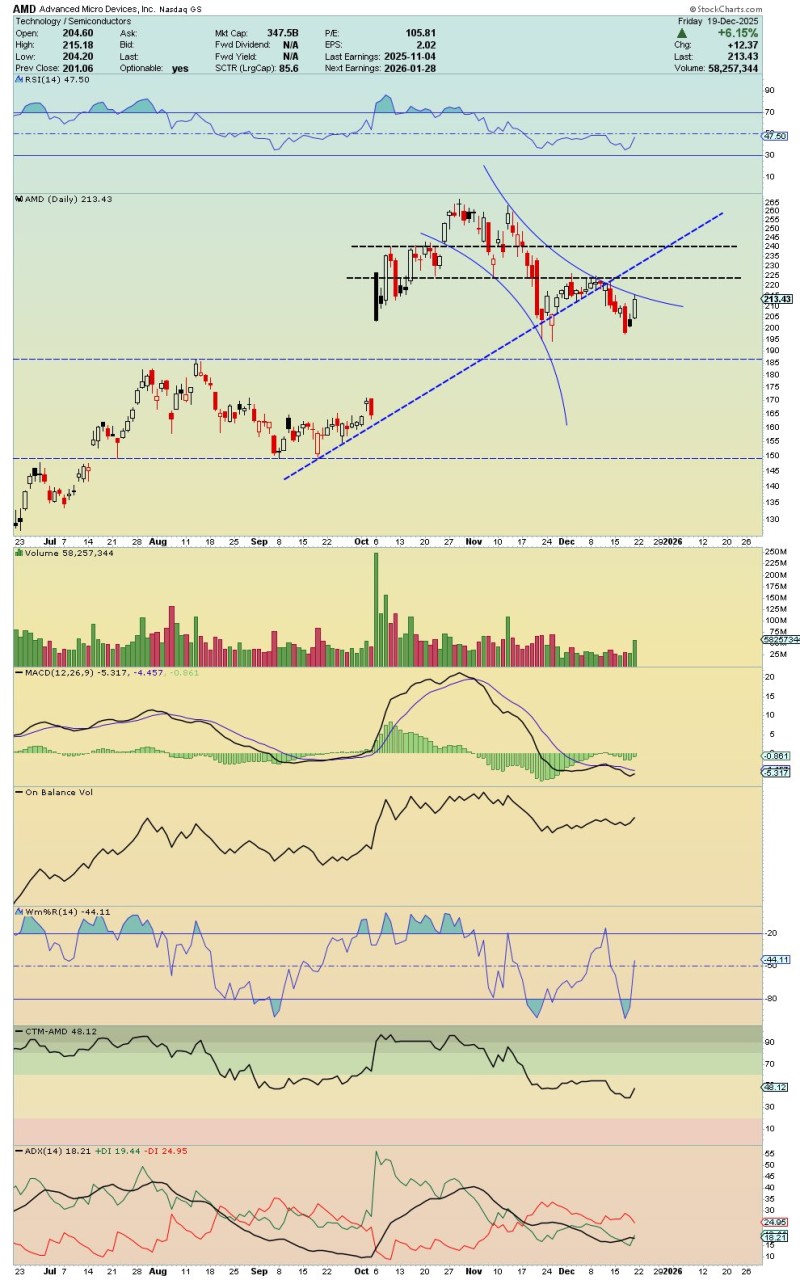
⬤ The chart reveals a symmetrical butterfly pattern taking shape after AMD topped out near $250 earlier this quarter. Since that peak, the stock has gone through a measured pullback, dropping below previous support and briefly touching the $200 area before bouncing. Resistance sits at $221 and $232, with a higher target zone around $252 that matches prior highs. Right now, AMD is sitting below that first resistance band, which points to consolidation rather than any clear trend.
⬤ The technical indicators show things are stabilizing but still mixed. RSI is hovering in the mid-40s, which is neutral territory rather than oversold. MACD is slightly negative but flattening out, suggesting the downside pressure has cooled compared to earlier in the correction. Volume patterns indicate selling has tapered off, while trend strength readings show the stock lacks clear direction—reinforcing that AMD is currently range-bound.
⬤ This setup matters beyond just AMD itself. As one of the major semiconductor stocks, AMD often serves as a barometer for the broader chip sector. How the stock handles the $221 zone could shape market sentiment heading into early 2026 and help clarify whether this pullback is just a breather or something more prolonged.
 Eseandre Mordi


