 Eseandre Mordi

AMD stock is quietly doing something worth paying attention to. After months of corrective pressure, the chart is starting to show the kind of structural reset that often comes right before a trend resumes. The recent pullback didn't break the broader setup — it may have actually strengthened it. With price now building higher highs off the 185 low and an impulsive wave structure taking shape, AMD is sitting at a technically important juncture. Here's what the Elliott Wave chart is showing.
The Correction That Completed the Reset
AMD's chart shows a clearly defined three-wave corrective pattern labeled (a)-(b)-(c), with the structure completing near the 185 region — the key invalidation zone.
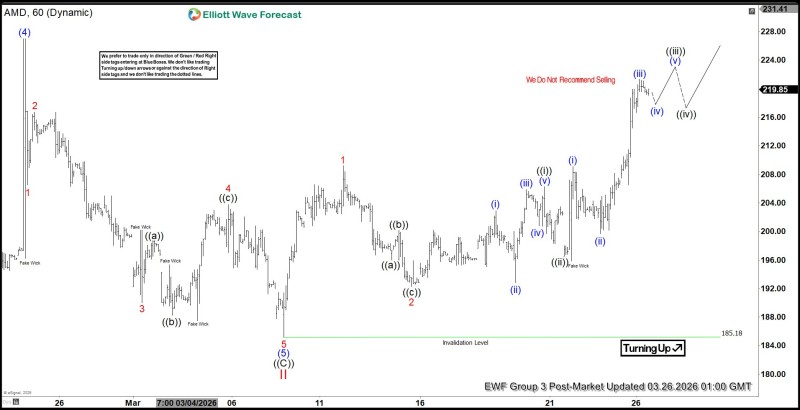
According to Elliottwave Forecast, the stock has finished a 3-swing correction, and that conclusion matters.
The conclusion of this structure signals that the broader trend may be ready to resume.
Price action since that low has shifted away from the overlapping, choppy movement that defines corrections and into something more directional. That behavioral change is consistent with previous AMD stock technical setups, where stabilization near key support has historically preceded renewed upside attempts.
From Base Formation to Impulsive Advance
Following the correction, AMD built a sequence of higher highs and higher lows, pushing from below 190 toward the 215-220 region. The chart labels this move as an emerging impulsive structure, with waves (i), (ii), (iii), and (iv) already visible on the chart.
That distinction is significant. The earlier corrective phase was choppy and overlapping. The current structure shows expansion — which is exactly what trend resumption looks like in Elliott Wave terms.
AMD has repeatedly held key support zones during pullbacks, reinforcing the idea that buyers remain active beneath price.
Buyers have continued defending pullbacks at each step, which adds weight to the idea that this isn't just a bounce but an early impulsive leg forming. Similar behavior appeared in AMD's move above $205, where support held before the stock extended higher.
Why This Pullback Near 219-220 Isn't Bearish
AMD is currently consolidating just below recent highs in the 219-220 range. The Elliott Wave read on this is that it's a wave (iv) pause, not a reversal. Several technical factors support that interpretation:
- Price remains well above the 185 invalidation level
- The trend structure continues to print higher highs
- Pullbacks are controlled and shallow
- The projected path points toward a wave (v) continuation
This kind of consolidation near resistance is typical in trending markets. As shown in the AMD $221 level analysis, these pause zones have previously resolved in the direction of the broader trend once resistance was absorbed.
The Structure That Keeps Buyers in Control
One annotation visible on the chart — "We Do Not Recommend Selling" — captures the directional bias built into this structure. AMD is no longer in a corrective phase. The market is transitioning into a trend-driven environment, and the projected wave path shows a short-term dip followed by another push higher, potentially toward the mid-220s and beyond.
As long as price remains above the key support zone and continues forming higher lows, the broader trend remains intact.
For now, AMD is holding its bullish structure. The next move may already be underway.
 Eseandre Mordi


