 Sergey Diakov

A sharp selloff in the NASDAQ triggered a reactive bounce from the 22.80 zone, but the recovery is now approaching a critical resistance band that could define the next move. As noted by Forex Sinyal Merkezi, the current rise appears to be a corrective reaction rather than a confirmed trend reversal — making the 23.20–23.30 area the key level to watch.
NASDAQ Breakdown That Defines the Current Structure
The chart reflects a clear bearish structure, with price previously forming lower highs and lower lows before stabilizing near 22.80. This level acted as a strong support where buyers stepped in, triggering a rebound.
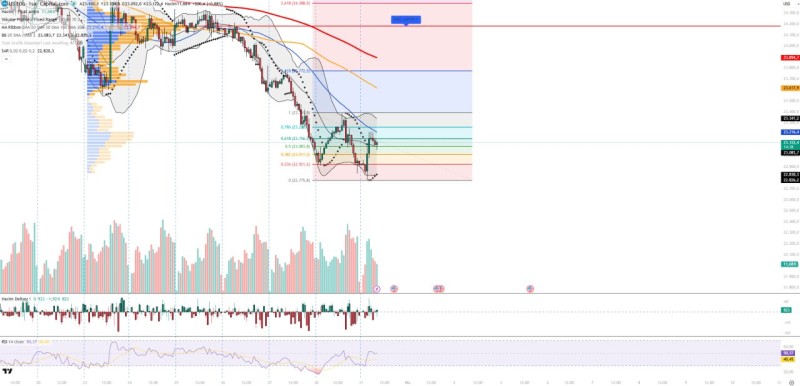
The bounce originated from the lower Bollinger Band, aligning with typical oversold reaction behavior. At the same time, volume increased during the recovery phase, signaling the presence of short-term buyers rather than long-term accumulation.
The current rise appears to be a corrective reaction rather than a confirmed trend reversal.
Despite this move, the broader structure remains unchanged. NASDAQ stalls near 23.6 lows as weak bounce loses steam — the downtrend is still intact, and the current recovery has yet to challenge any major resistance zones.
Why 23.20–23.30 Is the Key NASDAQ Resistance Barrier
The price is now testing the 23.20–23.30 resistance zone, which stands as the first major obstacle for buyers. This level must be broken decisively to signal any meaningful shift in structure.
Without a breakout above this range, the move is likely to remain a temporary correction. Similar setups have recently shown that rebounds often stall below resistance, keeping downside pressure intact.
If rejection occurs here, the market could rotate back toward support levels:
- 22.80 (initial support)
- 22.30 and 21.90 (deeper downside levels)
Rebounds often stall below resistance, keeping downside pressure intact.
A confirmed break above 23.30 would open the path toward higher resistance at 23.60 and 23.85, but such a move would require sustained momentum. Nasdaq 100 rebound faces pressure below 23.55 resistance — a pattern that continues to play out across recent sessions.
NASDAQ Indicators Show Stabilization, Not Strength
Momentum signals suggest recovery — but not a full reversal. RSI remains in the 40–50 range, indicating a move out of oversold territory but still lacking bullish strength. This aligns with a stabilization phase rather than a trend shift.
Other indicators reinforce this view:
- Volume increased during the bounce, reflecting reaction buying
- Parabolic SAR continues to signal a downtrend
- Market Profile shows the Point of Control near 24.17, marking a major resistance above
This positioning highlights that price is still trading below its key value area, leaving significant overhead pressure intact. NASDAQ price analysis: US100 weakens below 25,032 resistance with RSI near 50 — a recurring theme as the index continues to struggle with momentum.
Where the NASDAQ Structure Remains Fragile
The current setup reflects a typical corrective move within a broader downtrend. While buyers managed to defend the 22.80 level, they have not yet demonstrated the strength needed to reclaim higher zones.
Only a sustained move above 23.30 would begin to shift short-term momentum.
The inability to break resistance would reinforce the bearish structure and keep the market vulnerable to further downside. For now, the NASDAQ remains in a reactive phase — caught between short-term recovery and a still-dominant downtrend.
 Sergey Diakov


