 Victoria Bazir

⬤ The NASDAQ is pulling back after rejecting the 25,203.9 level on the hourly chart, with price now hovering around 24,959.4 — a sign that bullish momentum is fading. The short-term picture stays weak as long as the index trades below the 25,032.7 resistance, which now serves as the key barrier for any recovery. Earlier this week, NASDAQ was already trading under short-term bearish pressure after a decline from higher resistance levels, and the current price action continues that narrative.
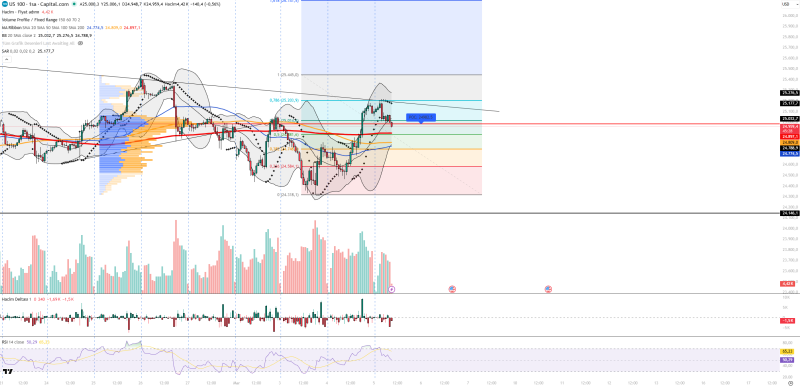
⬤ Momentum indicators are sending mixed signals. The RSI sits near 50.3 — essentially neutral, with no strong directional conviction either way. Volume, however, picked up during the recent selling wave, suggesting sellers are stepping in with some force. The Volume Profile places the Point of Control near 24,982.5, meaning price is still hovering around the zone of highest prior activity. Analysts also noted that NASDAQ was approaching the 25,000 resistance zone after recovering from lower support levels — a level the index is now struggling to hold above.
⬤ Additional indicators reinforce the downside bias. Volume Delta remains negative, pointing to sustained selling pressure across recent sessions. Bollinger Bands show price drifting near the middle band — typically a sign of indecision after a directional move. The Parabolic SAR is still positioned above price, confirming the short-term downtrend. Key support sits at 24,897.1, 24,809.0, and 24,584.1, while resistance holds at 25,032.7, 25,177.7, and 25,203.9. Prior analysis noted that NASDAQ was consolidating near major resistance after a rebound from the 24,500 support zone.
⬤ The macro backdrop isn't helping either. Rising geopolitical tensions, elevated oil prices, a stronger U.S. dollar, and higher bond yields are all putting pressure on growth stocks and risk assets broadly. These factors are adding to the cautious tone already visible in NASDAQ price action as the index navigates a cluster of technically significant levels.
 Victoria Bazir


