 Alex Dudov

The NASDAQ is struggling to recover after a sharp drop, with price now trapped near the lower end of its range. According to Forex Sinyal Merkezi, the index fell from the 24.3 area to around 23.5 and is now showing only a weak reaction near 23.7. This matters because the current structure reflects not stabilization, but a lack of demand - a key signal in technical analysis.
The current structure reflects not stabilization, but a lack of demand - a key signal in technical analysis.
The NASDAQ Breakdown That Reset Market Structure
The chart clearly shows a strong impulsive move lower, breaking the prior structure and shifting control toward sellers. Price moved rapidly from the 24.3 region down to 23.5, leaving behind a sequence of lower highs and confirming a bearish short-term trend.
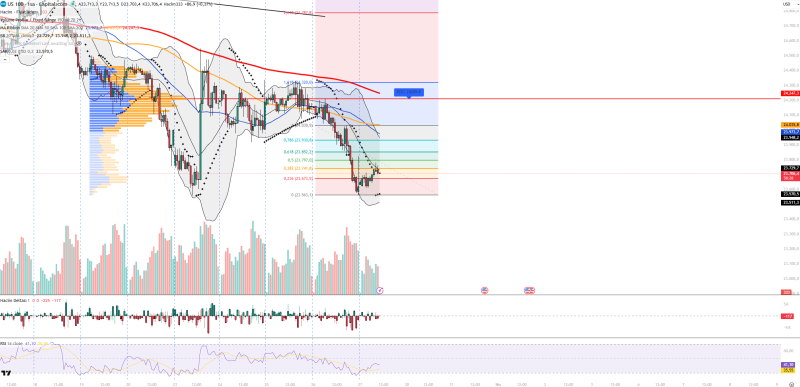
Since that move, the market has failed to produce a meaningful rebound. Instead, it has entered a narrow consolidation between 23.6 and 23.8 - which typically reflects continuation rather than reversal when it forms after a decline.
Another critical detail is the Volume Profile Point of Control (POC) near 24.2, positioned well above the current price. This indicates that the highest trading activity occurred at higher levels, leaving the current zone relatively thin in liquidity and vulnerable to further downside pressure.
Where NASDAQ Buyers Are Failing to Respond
Momentum indicators reinforce the weakness seen in price action. RSI is hovering around 40, signaling a lack of buying strength and keeping the market below neutral territory. At the same time, volume remains low - suggesting that neither side is aggressively stepping in, but importantly, buyers are not absorbing supply.
Several signals align with a bearish continuation bias:
- Price is holding near the lower Bollinger Band
- Volume delta remains negative, confirming selling pressure
- Parabolic SAR continues to signal a downtrend
This combination typically appears in markets where selling pressure is not necessarily accelerating, but demand is simply too weak to support a recovery.
This combination typically appears in markets where selling pressure is not necessarily accelerating, but demand is simply too weak to support a recovery.
The 23.6-23.8 NASDAQ Range That Will Decide the Next Move
The current range between 23.6 and 23.8 has become the key battleground. A breakout from this zone is likely to define the next directional move.
If price manages to break above 23.9, a recovery toward 24.1-24.3 becomes possible. However, this zone overlaps with prior breakdown levels and the high-volume area near 24.2, meaning any upside could face strong resistance.
On the downside, the 23.5 level remains critical. A break below it would confirm continuation of the bearish trend, opening the path toward deeper supports at 23.2 and 23.0. This type of structure - weak consolidation near lows - often precedes further downside unless buyers reclaim higher ground quickly.
What stands out is not aggressive selling, but persistent weakness. The NASDAQ is not collapsing - it is gradually slipping under the weight of low demand. This behavior is consistent with broader technical patterns seen in similar setups, where consolidation near support reflects hesitation rather than accumulation.
Unless the index reclaims levels above 23.9 with strong volume, the current stock market trend remains tilted to the downside, with sellers maintaining control.
Unless the index reclaims levels above 23.9 with strong volume, the current stock market trend remains tilted to the downside, with sellers maintaining control.
 Alex Dudov


