 Sergey Diakov

The Nasdaq 100 has staged a bounce after a sharp sell-off, reacting from the 22.90 support zone, but the move so far appears corrective rather than a confirmed reversal. Analysis shared by Forex Sinyal Merkezi highlights that with price still trading below key resistance, the broader structure suggests sellers remain in control unless higher levels are reclaimed.
Nasdaq 100 Price Action Shows Bearish Structure Below 23.55
Price action on the hourly chart shows a clear bearish structure, defined by consistent lower highs and lower lows. The recent rebound from the 22.90 area came after a sharp decline, aligning with oversold conditions and a touch of the lower Bollinger Band.
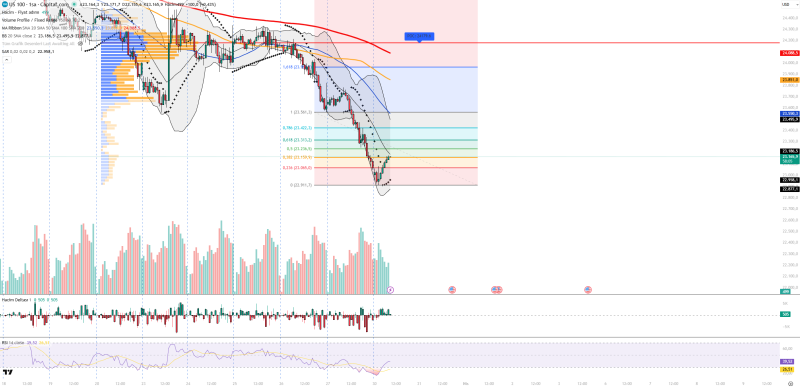
The bounce is supported by increased volume at the bottom, indicating the presence of reaction buyers. However, this type of activity typically reflects short-term positioning rather than sustained accumulation.
The current move is best viewed as a reaction within a broader downtrend.
Momentum indicators reinforce this interpretation. The RSI has recovered from deeply oversold levels around 26 into the high 30s, signaling stabilization but not strength. The broader trend remains downward, with price still trading below key dynamic resistance zones.
23.30-23.55 Zone Flips From Support to Resistance
The 23.30-23.55 range now acts as the first major resistance barrier. This zone previously functioned as support but has flipped into resistance - a common technical pattern that reflects trapped buyers exiting positions.
As long as price remains below this range, upside attempts are likely to face rejection. A confirmed break above this zone would be required to challenge the current bearish structure.
Above that, the Point of Control sits near 24.17, marking the main volume balance area. This level represents a significant overhead supply zone, reinforcing the idea that the market remains positioned below its equilibrium. Similar behavior has been observed in recent Nasdaq technical setups, where rebounds stalled below key resistance zones, keeping downside pressure intact.
Nasdaq Indicators Signal Recovery, Not a Trend Reversal
Several indicators point to a short-term recovery phase rather than a trend reversal:
- RSI: recovering from 26 to approximately 39, still below neutral
- Volume: increased activity at lows suggests reaction buying
- Bollinger Bands: bounce from the lower band
- Parabolic SAR: remains bearish, with a potential reversal signal approaching
These signals collectively highlight a market attempting to stabilize but lacking confirmation of a structural shift.
Buyers Step In, But Control Remains Limited
Immediate support remains at 22.90, followed by deeper levels at 22.30 and below if selling resumes. The current recovery lacks strong consolidation, with price moving quickly into resistance without building a solid base.
Unless buyers can reclaim key resistance zones and shift the structure, this type of price behavior often leads to renewed selling pressure.
This type of price behavior often leads to renewed selling pressure unless buyers can reclaim key resistance zones and shift the structure. Across broader stock market trends, similar patterns of rebound attempts failing below resistance have been observed, reinforcing the idea that recovery phases remain fragile without structural confirmation.
 Sergey Diakov


