 Saad Ullah

Tesla stock remains under pressure after a sharp correction from recent highs, with price now hovering around $355. According to analysis shared by Wall Street Günlükleri, both the technical structure and weakening margins point to increasing downside risk unless key levels are reclaimed.
TSLA Breaks Long-Term Structure, Enters Defined Downtrend
The chart shows Tesla breaking its long-term upward structure and moving into a defined downtrend. Price action is characterized by lower highs and consistent selling pressure following the peak near $490.
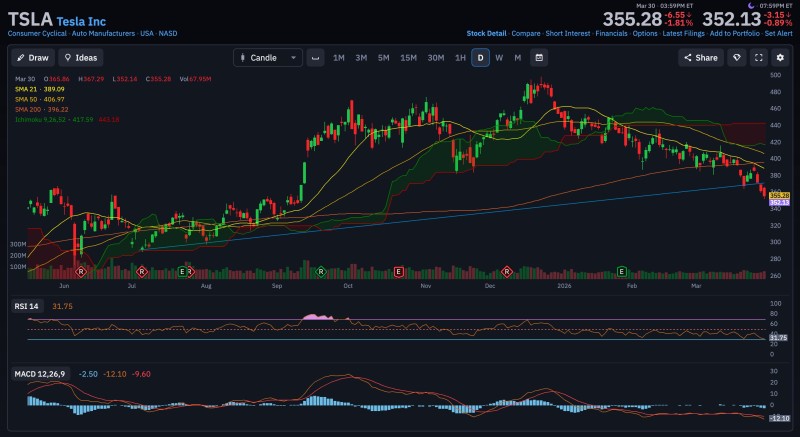
This transition reflects a move away from bullish continuation into a corrective phase, with the stock now trading within a downward channel. The breakdown from the top formation has triggered the current decline, aligning with the broader bearish structure visible on the chart.
The breakdown from the top formation has triggered the current decline, aligning with a broader bearish structure that suggests the corrective phase is still unfolding.
Tesla Drops Below the 21, 50, and 200-Day Moving Averages
Tesla is currently trading below the 21, 50, and 200-day moving averages - an important signal in technical analysis. The 200-day moving average, sitting near $396, now acts as a key resistance level.
Momentum indicators reinforce this bearish picture:
- RSI sits near 31.75, close to oversold territory
- MACD remains in negative territory
- Red volume bars increase during declines, showing strong selling pressure
This combination suggests that bearish momentum remains dominant unless price reclaims higher levels. Similar setups have been observed in recent analysis - TSLA Stock Tests $356 Fibonacci Support as Decision Zone Narrows Between $323 and $400 highlights how Tesla continues to struggle below key resistance zones.
When RSI approaches oversold levels while price remains below all major moving averages, short-term bounces are possible - but the dominant trend still belongs to sellers.
The $340-$350 Support Zone Is Now Tesla's Most Critical Level
The chart identifies the $340-$350 range as the main support area. Price is currently testing this zone, making it a decisive level for near-term direction.
Holding this range could trigger a short-term reaction, especially given the near-oversold RSI. However, a break below it would likely extend the decline further. This dynamic is consistent with what's been outlined in TSLA Stock Slides 10% as Valuation Debate Intensifies, where downside pressure accelerates once support zones give way.
TSLA Volatility Squeeze Signals a Big Move Could Be Forming
The current structure leaves Tesla in a vulnerable position. While short-term rebounds remain possible, the broader trend stays bearish as long as price holds below the 200-day moving average near $396.
The broader trend stays bearish as long as price holds below the 200-day moving average - any recovery attempt first needs to clear that level before bulls can regain control.
A longer-term perspective comes from TSLA Stock Signals Volatility Squeeze With $580 Target by Mid-2026, which shows how larger directional moves often follow periods of compression - making the current phase especially worth watching.
For now, Tesla remains in a downtrend. The key signal traders are watching is whether the $340-$350 support holds - or gives way to further downside.
 Saad Ullah


