 Saad Ullah

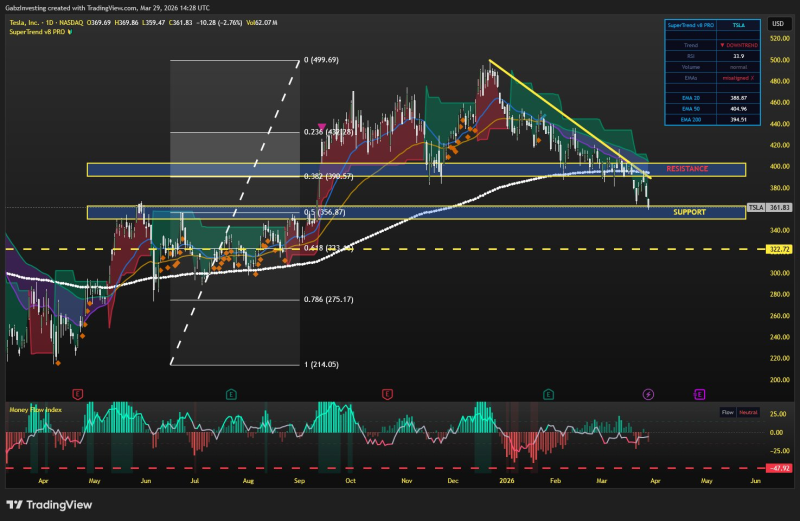
Tesla has returned to a technically decisive area, revisiting September 2025 price levels while testing a key Fibonacci retracement. As Gabz 🇪🇺 highlighted, the stock is now positioned at a decision zone - with neither bullish nor bearish confirmation in place.
The TSLA Downtrend That Defines the Current Structure
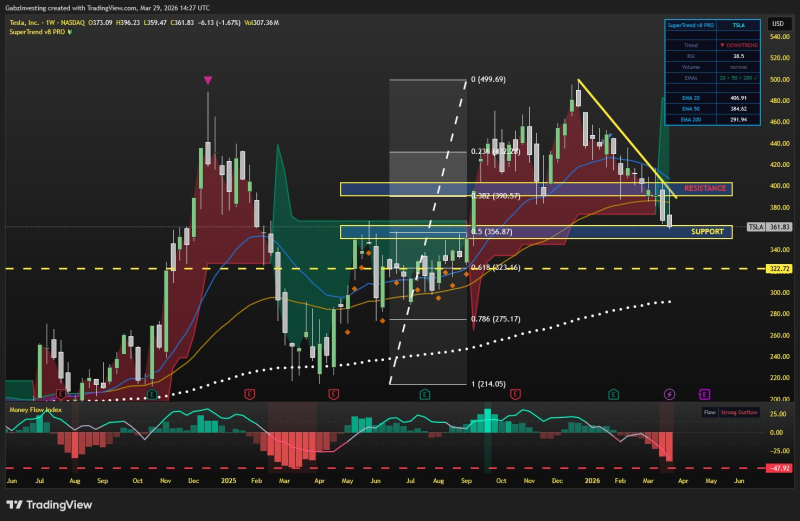
Both the daily and weekly charts show a confirmed downtrend, with price forming lower highs beneath a descending trendline. Recent attempts to stabilize have failed to reclaim higher levels, keeping pressure on the structure and reinforcing a bearish bias on higher timeframes.
The inability to push higher has shifted focus away from continuation and toward whether current support can hold at all.
Recent attempts to stabilize have failed to reclaim higher levels - focus has shifted from continuation to whether support can hold.
TSLA Stock Stays in Correction Below $418.86 Resistance captured the earlier stage of this corrective structure, showing how the failure to reclaim $418.86 set the stage for the deeper retracement now playing out near $356.
Why the $356 Fibonacci Level Is Tesla's Key Pivot
Price is currently sitting near the 0.5 Fibonacci retracement at approximately $356, which acts as a midpoint in the broader move and coincides with prior price action from September 2025 - adding historical significance to the level.
The structure is now compressing between clearly defined boundaries:
- Support: ~$356 (0.5 Fibonacci)
- Lower reference: ~$323 (0.618 Fibonacci)
- Resistance: ~$390-$400
- Trend: confirmed weekly downtrend
Tesla Holds $395 Support as Bollinger Bands Tighten Near $291-$499 Range documented the earlier compression phase at a higher level, showing how Bollinger Band tightening in Tesla has consistently preceded larger directional moves.
TSLA Momentum Shows Weakness, Not Capitulation
The Money Flow Index is around -39, indicating strong outflows - but not yet reaching historical extremes near -49. This distinction matters. Selling pressure is evident, but it has not reached levels typically associated with exhaustion. The chart reflects a market that is weakening but not yet fully washed out.
That combination - support holding, momentum negative but not extreme - is what makes this a decision zone rather than a confirmed signal in either direction. TSLA Stock Forecast: $300 Pullback Expected Before $1,000+ Rally outlines what the deeper retracement scenario looks like if $356 fails to hold - and why $323 may not be the final stop on the way down.
 Saad Ullah


