 Saad Ullah

Tesla shares are losing momentum in 2026, and the chart reflects a steady deterioration rather than a sharp selloff. The key question, as raised by Dividend Diplomats, remains whether Tesla's P/E ratio - often cited in the 150x-350x range - can be justified relative to its actual earnings profile.
TSLA Downtrend Takes Shape From 460 to 361
The chart shows TSLA firmly in a downtrend since early January, with price declining from the 450-460 region toward the current ~361 level. The structure is clean and consistent: lower highs and lower lows define the entire move.
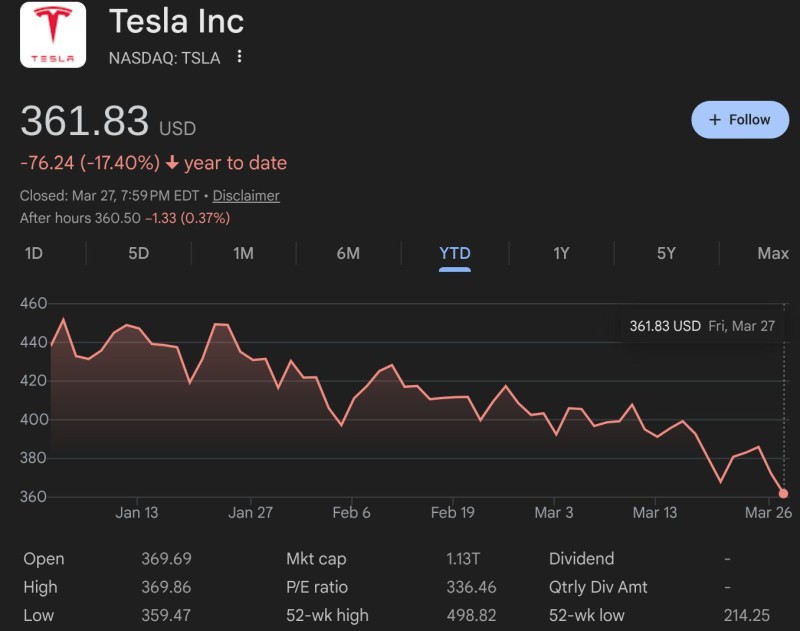
Attempts to recover into the 440-450 zone have repeatedly failed, confirming that former support has flipped into resistance. Each rally has been weaker than the last, signaling that buying pressure is fading.
By late March, the stock is testing the 360 area, which now acts as a near-term support zone. This level aligns with prior demand seen earlier in the year and remains the most immediate line where buyers could attempt to stabilize price. Recent data confirms that Tesla has been under steady pressure, with shares falling roughly 10% over the past month.
The Shift in TSLA Price Structure Is Clear
The price behavior highlights a gradual but important transition:
- Persistent lower highs since mid-January
- Repeated rejection near 420-440
- No strong bullish continuation patterns
- Increasing pressure toward the 360 support zone
This is not a volatile breakdown - it's a controlled decline. That distinction matters because it suggests repositioning rather than panic selling.
This is a controlled decline, not a collapse - the market is becoming more selective about how much premium it is willing to pay.
Tesla Valuation Debate Meets Technical Reality
The valuation discussion centers on how Tesla sustains such a high multiple relative to earnings per share. That question becomes more relevant when price action weakens.
From a technical standpoint, the market appears to be adjusting expectations. Readers tracking the broader TSLA cycle may also find context in Tesla's earlier break of key support levels, where downside risk was already flagged before the current slide extended.
This is where the chart and narrative intersect: price is no longer supporting the same level of optimism that once underpinned the premium multiple.
TSLA Pressure Builds Around 360 Key Support
The 360 zone now becomes critical. It sits within a broader demand range that has historically supported price, roughly aligning with the lower boundary of prior consolidation zones.
If buyers fail to defend this level, the structure opens the door to further downside continuation. For a deeper look at how this zone developed, TSLA's earlier test near $412 support provides useful context on where the current breakdown originated.
On the other hand, holding the 360 area could trigger a short-term stabilization - but the broader pattern of lower highs would still need to be broken to shift momentum.
The market is repricing Tesla within a weakening trend, and the broader pattern of lower highs still needs to be broken before momentum can shift.
For additional perspective on where TSLA stands relative to its longer-term moving averages, Tesla's approach to the 200-day moving average outlines the decision point that preceded the current pressure zone.
For now, TSLA is not collapsing - it is repricing within a weakening trend, and the chart suggests the market is growing more selective about how much of a premium it is willing to pay for Tesla's earnings story.
 Saad Ullah


