 Eseandre Mordi

⬤ Tesla is drawing fresh attention after its chart set up one of the most compressed volatility readings in the stock's history. Shares are trading around $407, bouncing off the 200-day simple moving average near $393. The Bollinger Bands on TSLA are the tightest ever recorded on its chart - a condition that often comes just before a sharp directional move. This support level was previously tracked in Tesla Holds $387 Pivot - 2nd Test in 5 Weeks.
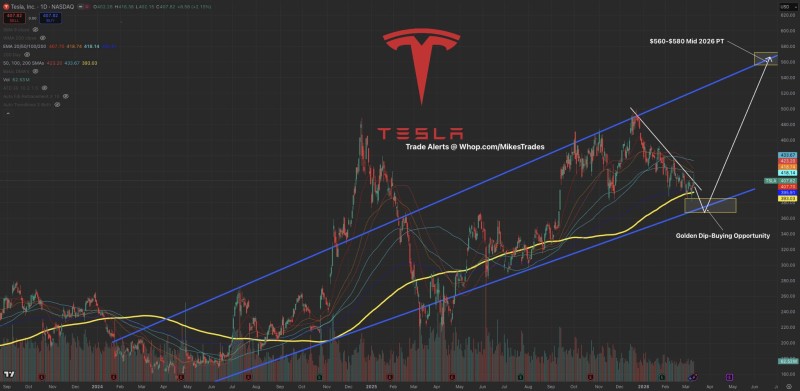
⬤ The chart shows Tesla trading inside a long-term ascending channel that has shaped its broader trend for years. After touching highs near $500, the stock entered a pullback phase while continuing to hold the rising support structure. Price is now approaching the lower edge of the channel, which analysts describe as a potential accumulation zone or "golden dip buying opportunity." A similar breakout setup was outlined in TSLA Price Analysis: Tesla Eyes Break Above 421 Toward 427.
Periods of shrinking volatility build pressure for larger price movements once consolidation ends.
⬤ The projected target sits between $560 and $580 if channel support continues to hold through mid-2026. How tightening ranges and key support levels precede the next leg up was also covered in Tesla Pulls Back Toward $419 Target Zone.
⬤ Beyond the chart, several fundamental catalysts are keeping Tesla in focus: progress toward unsupervised Full Self-Driving, the upcoming Cyber Cab rollout, AI-driven energy storage expansion, and the broader US robotaxi buildout. These developments, combined with the historically tight volatility structure, are fueling growing expectations for a renewed upward cycle.
 Eseandre Mordi


