 Artem Voloskovets

Tesla is undergoing a sharp correction after declining from around $498 to the mid-$350s — a move consistent with patterns the stock has shown in previous years. According to analyst Alex, early-year weakness in TSLA has historically been followed by recovery phases later in the year, and the current decline fits that broader tendency.
A Controlled Decline, Not a Collapse
The chart shows Tesla transitioning from a strong uptrend into a corrective phase. After failing to hold near the $490-$500 region, price began forming lower highs, confirming a shift in momentum.
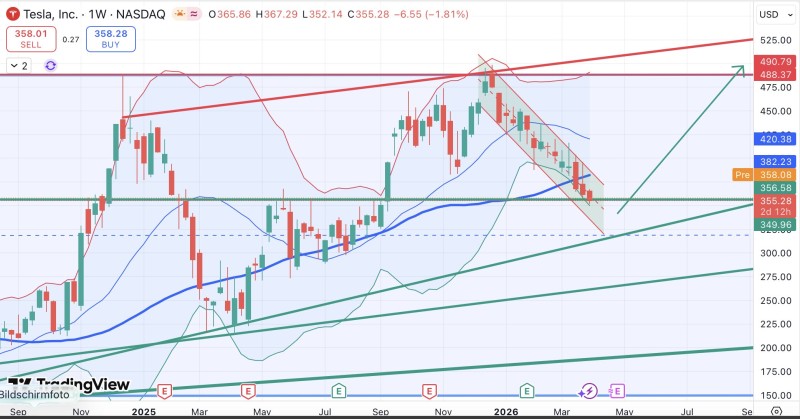
This move aligns with broader TSLA behavior in 2026, where the stock has been trending lower in a structured way rather than collapsing. Recent analysis also points to a steady deterioration with consistent lower highs and pressure toward key support zones. TSLA Stock Slides 10% as Valuation Debate Intensifies offers additional context on the broader selling pressure driving this move.
The decline appears organized, suggesting repositioning rather than panic selling — an important distinction in technical analysis.
The $350 Support Zone Under Pressure
Tesla is currently trading near the $350-$356 region, which stands out as a critical technical level. This area aligns with a key Fibonacci retracement and prior price structure, making it a decisive zone for the next move.
The stock is now sitting at a major pivot where neither bullish nor bearish confirmation has emerged yet. Holding this level could stabilize price, while a break lower would open the door toward deeper support. TSLA Stock Tests $356 Fibonacci Support as Decision Zone Narrows Between $323 and $400 breaks down exactly why this zone matters technically.
Similar declines in the first half of the year have previously been followed by recoveries later on.
A TSLA Pattern Investors Have Seen Before
The current structure reflects a broader cyclical tendency in Tesla stock. Similar declines earlier in the year have previously been followed by recoveries, aligning with the long-term technical picture where Tesla often experiences sharp pullbacks within an overall upward trajectory. Historical price action shows repeated cycles of volatility, with corrections resetting momentum before the next move higher.
The Signal Traders Are Watching Now in TSLA
The key focus is whether Tesla can hold current levels and begin forming a base. While the stock is already showing signs of weakness, the structure does not yet confirm a full breakdown.
Longer-term setups continue to point toward potential upside if support holds.
TSLA Stock Signals Volatility Squeeze With $580 Target by Mid-2026 outlines how similar pullbacks within a broader channel can precede renewed upward moves. For now, TSLA remains in a corrective phase. The next move will likely depend on whether support near $350 holds — or gives way to further downside before any recovery attempt begins.
 Artem Voloskovets


