 Peter Smith

MSFT stock is not just pulling back — it is doing so into one of the most significant support zones on the chart, while momentum indicators flash readings not seen since the 2022 bear market. That combination of price location and extreme RSI compression is drawing serious attention from technical traders watching whether this level holds or breaks.
A Sharp Pullback Into Structural Support
MSFT stock is now testing a critical higher-timeframe support zone after a steep drawdown, with momentum indicators signaling one of the most oversold conditions in recent years. Analyst Chris pointed to this setup as a key technical inflection point, where the reaction from this level could define the next move. The chart shows MSFT correcting aggressively from its highs, with price now sitting directly inside a major horizontal support zone around the mid-$300s.
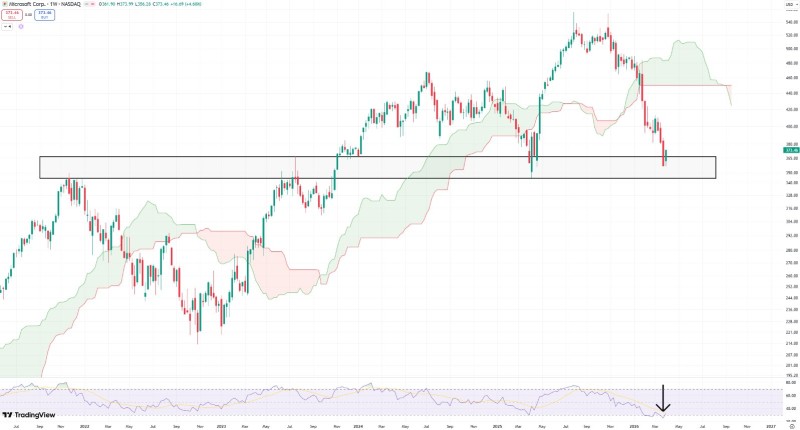
This area previously acted as a consolidation base, making it a level where market participants typically expect a reaction. The move lower has been fast and directional, with price stepping down into support rather than gradually stabilizing.
Price is sitting at a major horizontal support zone that previously acted as a consolidation base, making it a critical level where demand has historically appeared.
This kind of behavior often reflects strong selling pressure, but it also brings price quickly into zones where demand historically showed up. Microsoft Tests $350 Support Zone With Oversold Weekly Signal, reinforcing how significant this zone is within the broader stock market trend.
MSFT Weekly RSI Drops Below 2022 Bear Market Lows
One of the most notable features on the chart is the weekly RSI, which has dropped to levels even below prior major stress points, including the 2022 bear market and the April 2025 selloff. In technical analysis, RSI below 30 is typically considered oversold, signaling that selling pressure may be stretched. Here, the indicator has moved even deeper into that territory, marking a rare condition for a mega-cap stock like Microsoft.
Weekly RSI has moved below levels seen during the 2022 bear market, marking one of the most oversold readings for Microsoft in recent history and signaling that selling pressure may be significantly stretched.
MSFT Risks Historic Break Below Its 200-Week Moving Average - this is where the current RSI reading adds real weight to the technical picture, reflecting extreme downside momentum rather than any sign of stabilization.
MSFT Price Structure: Support Without Confirmation
Despite the attractive location, the chart does not yet show a confirmed reversal. Price remains within a corrective structure, and there is no clear shift back to higher highs or strong bullish momentum. This is the key distinction in the setup: being at support is not the same as confirming a bottom. Current structure reflects:
- Price sitting at a major horizontal support zone
- Momentum deeply oversold on a higher timeframe
- No confirmed bullish reversal signal yet
The setup creates tension between extreme positioning and the absence of confirmation. That tension is what makes this level so closely watched right now. MSFT Price-EPS Gap of 33% Signals Potential Opportunity adds further context to the fundamental backdrop sitting beneath the technical picture.
When Value Meets Market Reality
The current MSFT setup highlights a broader dynamic often seen in technical analysis. When price reaches a strong support level with extreme momentum readings, the debate shifts from trend continuation to potential opportunity. At the same time, the chart still reflects a market adjusting after a sharp decline. Whether this level becomes a base or simply a pause within a larger correction depends entirely on how price reacts next. For now, MSFT is not just oversold - it is positioned at a level where the market must decide whether that oversold condition actually translates into demand.
 Peter Smith


