 Alex Dudov

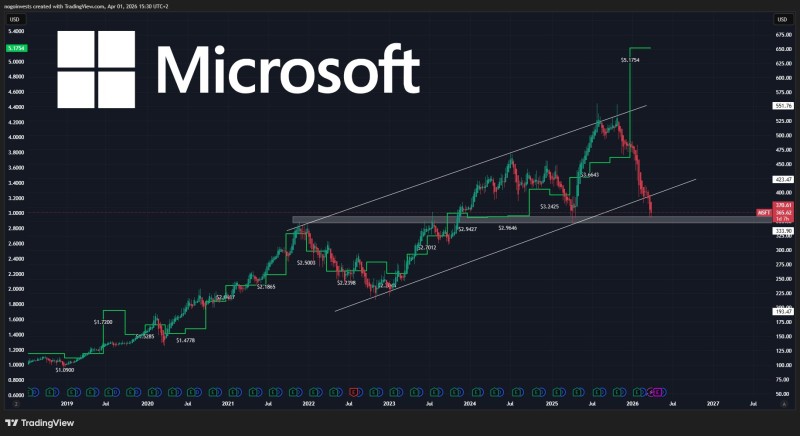
Microsoft is showing a notable divergence between price and earnings, with shares sitting roughly 33% below their all-time high while EPS continues to reach new records. Writing for StockChaser, the analyst points out that the chart currently reflects one of the largest gaps between price and earnings in recent years - putting focus squarely on whether this disconnect represents risk or opportunity.
The chart makes the divergence hard to ignore. Price has declined sharply from its peak, while the earnings trend continues upward without interruption. This creates a visible gap between market valuation and the underlying earnings performance that has historically been unusual for a company of Microsoft's scale.
MSFT is currently about 33% below its all-time high while earnings continue to print new highs - one of the largest disconnects seen in years, making it a notable moment for market participants.
Similar situations in the past have historically resulted in buying opportunities when price traded at a discount relative to EPS. The current setup follows that same pattern, though resolution is never guaranteed on timing alone.
A structure that has pulled back sharply from its highs
The chart shows a strong long-term uptrend followed by a steep correction. Price moved from a series of higher highs into a clear decline, bringing it back toward a key horizontal area that previously acted as a major level. Recent Microsoft stock analysis covering the gap zone at a key technical level reflects similar dynamics - price corrections occurring despite continued earnings growth, often leading to renewed interest at lower levels.
This pullback represents a significant shift in momentum but does not, on its own, confirm a long-term reversal. Instead, it highlights a period where price is adjusting relative to its prior expansion.
Price has a way of eventually aligning with earnings - but the direction and timing depend entirely on whether earnings strength holds through the next reporting cycle.
The question behind the MSFT price move
The central uncertainty is whether the strength in earnings is sustainable or whether the market is simply reacting to near-term sentiment. The divergence between rising EPS and falling price creates a scenario where the market is either:
- Repricing due to changing expectations around Microsoft's growth outlook
- Or temporarily misaligned with underlying earnings strength
Both readings are plausible at this stage, and neither can be confirmed without watching how price behaves at current levels. MSFT stock forecast coverage identifying the blue box as a key buying zone has flagged similar technical setups where valuation resets have followed strong runs, bringing price closer to fundamental support.
A disconnect that defines the current MSFT setup
The current structure is defined entirely by the gap between price and earnings. At 33% below the all-time high, Microsoft is trading in a zone characterized by divergence rather than confirmation. The next move will depend on whether that gap begins to close - and in which direction the market decides to resolve it.
When price corrects this far while EPS keeps printing new highs, you either have a buying opportunity or a warning that the earnings trend is about to break. The chart alone cannot answer which one.
Broader coverage tracking MSFT's bullish sequence toward the $600 target has noted how the stock's longer-term structure still leans constructive, even as the short-term picture remains uncertain. Whether price catches up to earnings - or earnings eventually retreat toward price - is the question that will define Microsoft's next major move.
 Alex Dudov


