 Marina Lyubimova

Microsoft is approaching a level that has quietly defined its long-term structure for over 12 years - and what happens next could matter well beyond one stock. As analyst jbulltard pointed out, MSFT is on track to close below its 200-week moving average, a line that survived COVID, the brutal 2022 selloff, and the 2025 volatility cycle. Right now, price is testing - or in some readings, slightly cracking - that historically reliable floor.
The MSFT Moving Average Line That Held for Over 12 Years
The weekly chart tells a clear story. After peaking above $550, MSFT stock has carved out a sequence of lower highs and picked up downside momentum, breaking through multiple shorter-term moving averages along the way. But none of those levels carry the weight of what's being tested now.
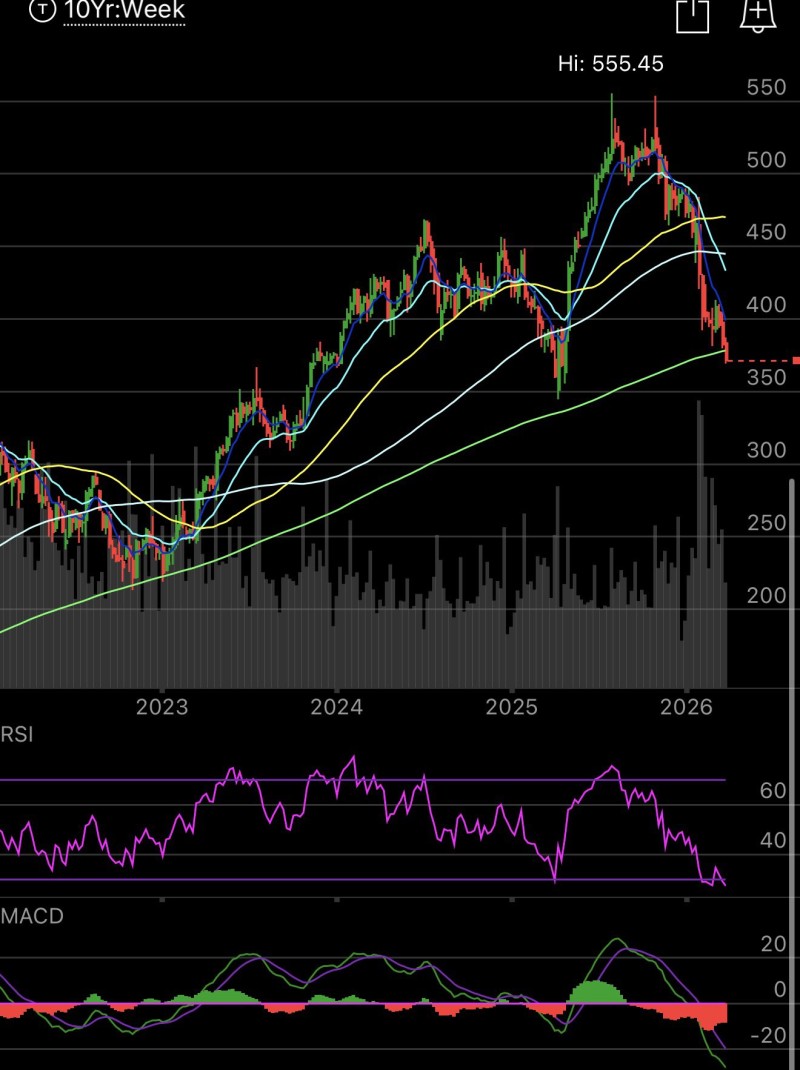
The 200-week moving average has acted as a structural floor for MSFT for more than a decade. Every prior test ended the same way - price touched the level, stabilized, and continued higher. That kind of consistency tends to reinforce itself, with buyers stepping in precisely because the level has held so many times before.
MSFT is on track to close below its 200-week moving average - a level that held through COVID, the 2022 downturn, and the 2025 volatility cycle.
According to recent coverage, Microsoft has held its 200-week moving average for over a decade without a weekly close below it, reinforcing just how rare this moment actually is.
When the MSFT Stock Floor Starts to Crack
What makes the current setup different isn't just the level being tested -- it's how it's being tested. In previous cycles, price hit support and bounced hard. This time, MSFT is grinding lower with persistent selling pressure rather than a sharp rejection. Momentum indicators back that up: RSI is trending toward oversold territory and MACD is expanding to the downside.
Reports also note that MSFT consolidates near $380 support with no confirmed bounce signal, which points to hesitation rather than accumulation. Buyers aren't showing the same conviction they did in prior cycles.
Instead of a sharp rejection and bounce, price is grinding lower into the level with sustained selling pressure -- momentum indicators confirm the shift, with RSI trending toward oversold and MACD expanding to the downside.
The pattern of behavior matters here. A level can technically hold while still losing its psychological power. The absence of a strong bounce is itself a signal worth watching.
A Structural Shift in MSFT's 13-Year Price History
The broader picture is coming into focus: Microsoft approaching the 200-week moving average marks a rare inflection point seen only a few times in 13 years. That context alone elevates this test above typical market noise.
The transition underway in MSFT's chart structure is subtle but meaningful:
- Price is no longer bouncing cleanly from support
- Momentum continues to favor sellers
- The long-term trend is being actively tested rather than respected
Microsoft has historically been a leader in broader stock market trend - often holding key structural levels during periods of stress. If this level fails to hold on a weekly closing basis, it would mark a significant departure from historical behavior.
MSFT has long been a bellwether for mega-cap tech. When it holds structural levels during stress, it signals resilience across the sector. A confirmed weekly close below the 200-week moving average would do the opposite - and could force a broader reassessment of how durable long-term support really is in names like this.
 Marina Lyubimova


