 Saad Ullah

⬤ The weekly chart of MSFT shows the stock holding at a significant support area around the long-term pivot and moving average zone, with a very low relative strength index reading indicating oversold conditions. Chart patterns and moving average tests suggest a possible base forming in the mid-$300s as the broader downtrend has eased.
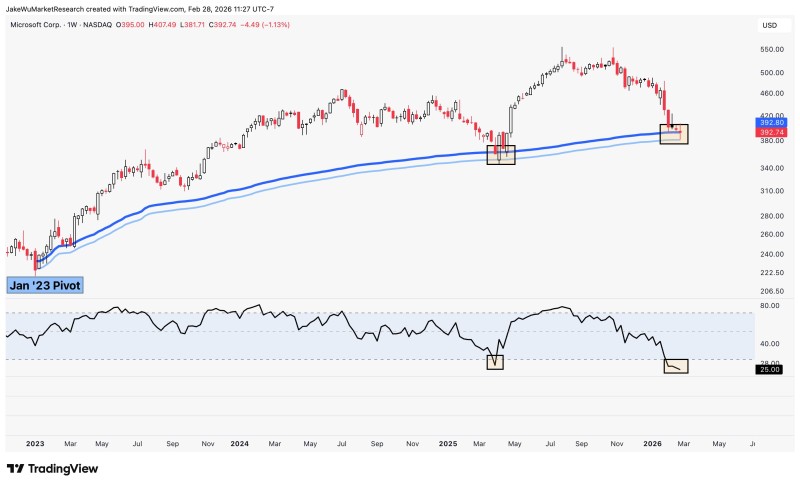
⬤ Current momentum readings corroborate the oversold setup, with MSFT's relative strength index at levels often associated with trend exhaustion. This aligns with technical observations showing how Microsoft often responds to deep retracements near the 200-week support area. Support around the high-$300s has historically acted as a structural floor, with each retest tending to precede rebounds in earlier cycles.
"The interplay of historical support behavior and current technical conditions may influence how similar large-cap stocks navigate extended pullbacks," notes the analysis.
⬤ Despite the technical bounce signs, the broader weekly trend still reflects a retreat from the prior multi-year uptrend highs, and any upside shift will likely depend on sustained demand emerging around this support region. With the stock approaching this long-term support cluster and oversold technical readings around the $380 key level, the scenario remains a critical juncture in determining whether the current pullback transitions into stabilization or if further downside unfolds toward lower price bands.
⬤ Whether Microsoft can maintain support in this oversold environment matters to broader market sentiment, given the company's weight in major indices and tech sector performance. The pullback toward $350-$360 echoes historical bounces seen at similar support zones, making this a crucial test for both the stock and tech sector.
 Saad Ullah


