 Saad Ullah

⬤ Microsoft's stock moved straight into a gap zone that traders had been watching closely. Noted that MSFT filled the gap with precision—the price touched the marked area and then stabilized, showing how technical levels can influence trading behavior.
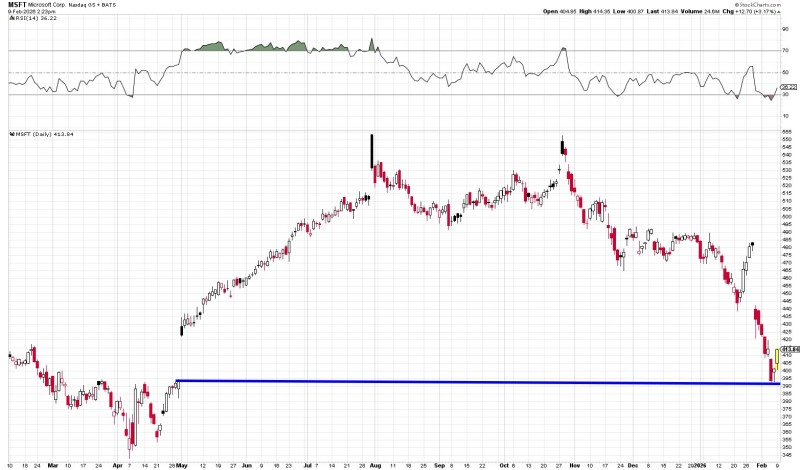
⬤ Gap fills are a classic chart pattern where price returns to areas that traded with minimal liquidity during rapid moves. Markets tend to revisit these zones eventually, and when they do, activity often slows down as traders reassess what comes next. We've seen similar reactions before in MSFT stock forecast buying zone where technical markers acted as turning points.
⬤ This happened after Microsoft had been climbing for a while, bringing the stock back into alignment with its earlier price structure. Technical traders pay close attention to these spots because they represent historical imbalances between buyers and sellers. You can see comparable gap interactions discussed in AMD gap zone reaction and broader market movements covered in Microsoft market positioning changes.
⬤ Why does this matter? When widely watched technical levels get hit, they tend to shift short-term sentiment. Price interacting with these historical imbalance areas usually causes traders to recalibrate their momentum expectations and adjust their positions around MSFT accordingly.
 Saad Ullah


