 Usman Salis

After several months of solid gains, Microsoft's stock has hit a correction phase. For most traders watching the daily moves, this might look like just another routine dip. But if you dig into Elliott Wave analysis, there's something more interesting happening here. The stock is now sitting inside what technical analysts call the "Blue Box" — a zone that historically has shown a strong tendency to reverse upward. If the support at this level holds firm, we could be looking at the setup for the next bullish wave.
Elliott Wave Analysis of MSFT
Based on analysis from Elliottwave Forecast, Microsoft's recent price movement shows a textbook five-wave advance that topped out around $582 late last summer. That peak marked what wave theorists call wave (III). Since then, the stock has been working through a corrective wave (IV), which is exactly what you'd expect in a healthy uptrend.
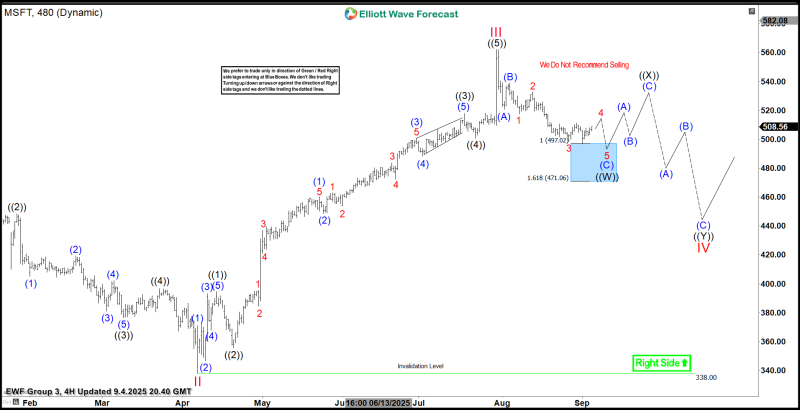
Key technical levels to watch:
- Blue Box Zone sits between $497 and $471, representing a Fibonacci-based support area where buyers typically step in
- The invalidation level remains at $338 — as long as the price stays above this threshold, the bullish case stays intact
- The next potential wave (V) could push toward new highs beyond $520 if this correction wraps up here
Why Investors Remain Bullish on Microsoft
The technical picture doesn't exist in a vacuum — it's backed by some pretty solid fundamentals. Microsoft continues to embed artificial intelligence deeper into its ecosystem, from Azure cloud services to Copilot and the entire Office suite. Azure itself keeps expanding globally, which strengthens the company's long-term growth story. And let's not forget that Microsoft has a track record of beating earnings expectations, even when the broader economy shows signs of slowing down. When you put it all together, these pullbacks start looking less like red flags and more like chances to get in at a better price.
The real test comes at that $497 to $471 range. If we see the stock bounce convincingly from this zone, it would be a strong signal that wave (V) is beginning. A clean break above $520 would basically confirm that the bulls are back in control. Beyond just price action, keep an eye on volume trends. If buying activity picks up noticeably in this zone, it would add weight to the rally scenario.
 Usman Salis


