Artem Voloskovets

Microsoft stock is once again pulling away from its long-term earnings trajectory, and if the past 25 years of chart history means anything, that gap tends to close in one direction. According to Qualtrim, every meaningful disconnect between MSFT's price and its EPS over the past quarter-century has lined up with a staggered buying opportunity rather than a structural breakdown.
The setup playing out right now is familiar. Earnings per share keep climbing toward new highs while price has pulled back toward the mid-$300 range. That divergence is precisely what creates the valuation compression long-term investors tend to watch for.
A Recurring Pattern in MSFT's 25-Year Earnings Structure
The long-term chart tells a consistent story. EPS has compounded steadily over decades, while price moves in cycles - stretching above the earnings curve during bullish runs, then reverting back during corrections. The current phase looks like one of those reversion windows.
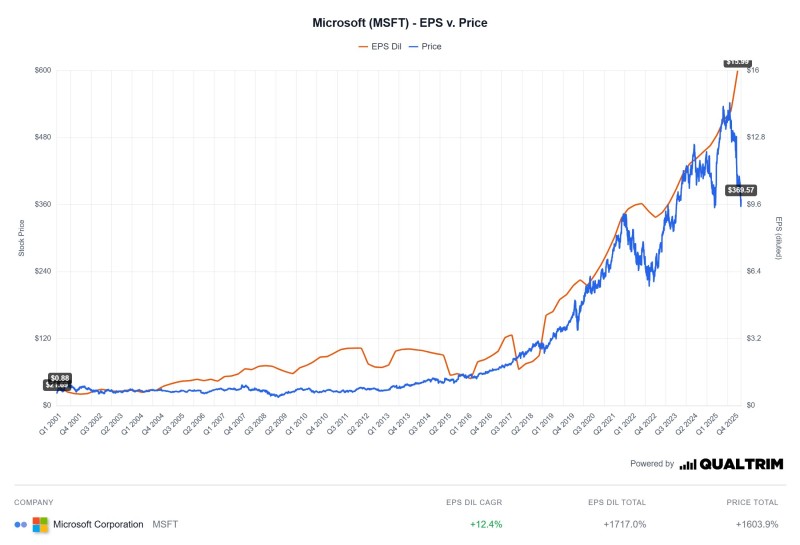
What makes this moment worth paying attention to is that the pullback hasn't been accompanied by any deterioration in earnings. EPS continues trending higher. Price is simply catching down to a level that better reflects underlying fundamentals, which is historically where accumulation tends to begin rather than where it ends.
Every time price has disconnected meaningfully from earnings over the past 25 years, it has lined up with a buying opportunity - not a breakdown.
How the Price-EPS Cycle Repeats
The structure visible on the chart isn't random. It follows a repeating sequence:
- Price expands faster than EPS during bullish phases
- A correction brings price back toward the earnings trend line
- The valuation gap narrows as price lags and EPS catches up
- A new upward phase begins from a more balanced starting point
This rhythm has defined MSFT's long-term trend across multiple market cycles. The current pullback appears to fit that framework as a corrective phase rather than a reversal of the broader trend.
The pullback brings price closer to its underlying earnings trajectory, compressing valuation to levels that have historically attracted long-term buyers.
The Pullback That Resets the Trend
The most recent move shows a clear rejection from highs followed by a sharp retracement. From a technical standpoint, the long-term structure remains intact - higher highs and higher lows across cycles - and the current decline sits within that broader framework as a normalization move.
Recent market context supports this reading. Microsoft stock trading near key technical levels reflects lower valuation ranges relative to historical averages, even as earnings strength continues. That kind of compression tends to mark periods where long-term positioning becomes more attractive, not less.
A 21x Forward Multiple Reopens the Valuation Window
The forward multiple has reset to near 21x alongside the price decline. That figure matters because it quantifies what the chart shows visually - valuation has pulled back to a range that has historically coincided with renewed buying interest, particularly when EPS remains on an upward trajectory.
When price drifts too far below the earnings path, history suggests the resolution tends to come through upside re-alignment rather than prolonged downside.
Prior cycles have shown this dynamic repeatedly. Price dislocations relative to EPS have resolved upward once valuation reset to a range where the earnings trajectory could carry price higher. The MSFT blue box buying zone framework identified in earlier analysis pointed to exactly this kind of setup.
Microsoft's long-term positioning continues to be defined by its earnings path. When price drifts too far from that path on the downside, the 25-year pattern consistently suggests reversion that favors upside continuation - and right now, that gap is open again.
 Artem Voloskovets