Saad Ullah

⚫Amazon has triggered a death cross on its daily chart - the 50-day moving average has crossed below the 200-day moving average. According to AMZN Stock Tests Key 200-Day Moving Average, this is the first time AMZN has produced this signal since April 2025, when a similar crossover appeared near a price bottom just before the stock began recovering.
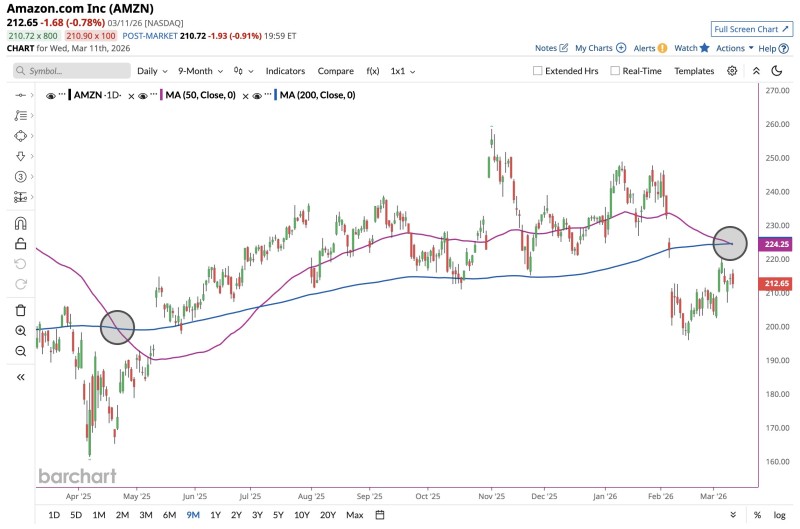
⚫Amazon shares are currently trading near $212.65, while the crossover itself formed around the $224 level. The stock hit a high near $250 in late 2025 before entering a corrective phase in early 2026. The 50-day MA is now angling downward beneath the 200-day MA, visually confirming the bearish technical setup.
A death cross does not always signal prolonged downside - it often marks a transitional period when momentum is shifting,
⚫ April's death cross is the clearest precedent. The shorter moving average briefly dipped below the longer one during a consolidation period - and then Amazon reversed and climbed steadily for months. As noted in AMZN Stock Forecast: AMZN Faces Key Levels Below $230, major moving averages have consistently shaped AMZN's trend direction throughout the past year.
⚫ The signal's bearish label doesn't guarantee further losses. Death crosses frequently appear during transitional phases rather than at the start of extended declines. Analysis in AMZN Extends Decline With $211 Target in Elliott Wave Analysis points to $211 as a key support level, with price action around that zone likely to determine whether weakness continues or gives way to consolidation.
⚫ With AMZN trading below both major moving averages while the crossover develops, the stock is at a critical technical juncture. How it behaves near current support levels could define sentiment toward Amazon over the coming weeks.
 Saad Ullah