 Saad Ullah

Amazon's stock (AMZN) has reached a pivotal technical zone that may shape its direction in the coming weeks. Following a solid rally earlier this year, shares have retreated and are now testing the 200-day moving average (MA200) - a threshold often viewed as the line between bullish momentum and bearish pressure.
Chart Analysis: Long-Term Support in Focus
The chart shows Amazon hovering near $215, sitting right on its 200-day moving average (red line). Trader Shaun Trades notes this level has historically drawn institutional interest, making it a zone worth watching.
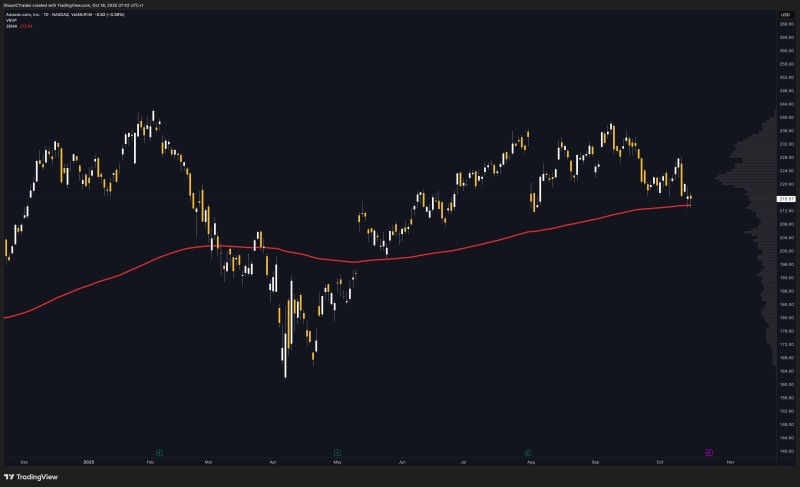
Amazon rallied sharply after spring lows but has since entered a pullback phase marked by lower highs. The 200-day MA around $213–$215 is now acting as immediate technical support, while the volume profile reveals concentrated trading activity just below current prices, hinting at possible demand if the stock dips further.
Broader Market Context
This setup unfolds amid pressure on mega-cap tech stocks. Rising U.S. bond yields are weighing on growth valuations, while concerns about consumer spending ahead of the holiday season add uncertainty. Market rotation has also seen investors shifting capital across different sectors. That said, Amazon's fundamentals hold up well. The company continues to see strong growth from Amazon Web Services (AWS) and its expanding advertising operations, which help balance softer e-commerce trends.
What to Expect Next
If AMZN holds above the 200-day MA, it could trigger a bounce toward the $225–$230 range. A breakdown below this support, however, might invite more selling, with $200 standing out as the next meaningful floor. For investors, the 200-day moving average isn't just a technical marker - it's a real-time test of confidence in Amazon's long-term outlook.
 Saad Ullah


