Artem Voloskovets

⬤ Amazon continues its downward move, with the stock still trading within an impulsive decline from its recent peak. The current wave structure shows that AMZN hasn't finished its downward sequence yet, and the price remains in a controlled corrective phase that could push even lower. The chart clearly maps out where this might be headed next.
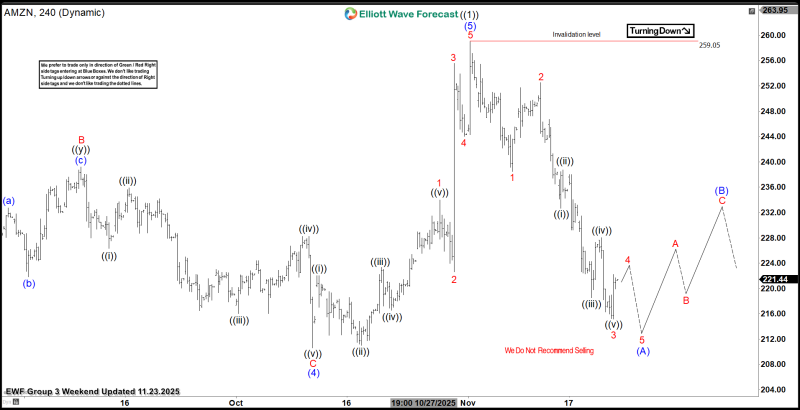
⬤ The updated Elliott Wave chart shows a clean five-wave pattern driving the decline, with Amazon recently trading near $221. The structure suggests another leg down is still on the table, targeting the $211 area before the next phase kicks in. This lines up with the internal subdivisions on the chart, where wave 5 looks unfinished and continues pulling the stock toward deeper support levels.
⬤ Once AMZN approaches the $211 zone, the market could start a three-wave A-B-C recovery. The chart maps out this potential bounce path, though it all depends on the decline wrapping up its final wave first. The invalidation level sits near $259, well above current prices, which means the downward structure is still holding up for now.
⬤ This matters because Amazon is a heavyweight in U.S. equity indices and regularly moves broader market sentiment. A continued drop toward $211 would confirm the ongoing correction in tech stocks, while a structured bounce afterward could show whether AMZN can rebuild momentum or just keep grinding sideways in a wider range.
 Artem Voloskovets