Alex Dudov

Amazon is showing a potential structural reversal, moving from a prior double top into a developing double bottom formation. According to Banana3, the setup now points to three clear upside targets, signaling a possible shift in the stock's broader trend.
The AMZN Pattern Flip That Changed Direction
The chart reflects a clear transition in structure.
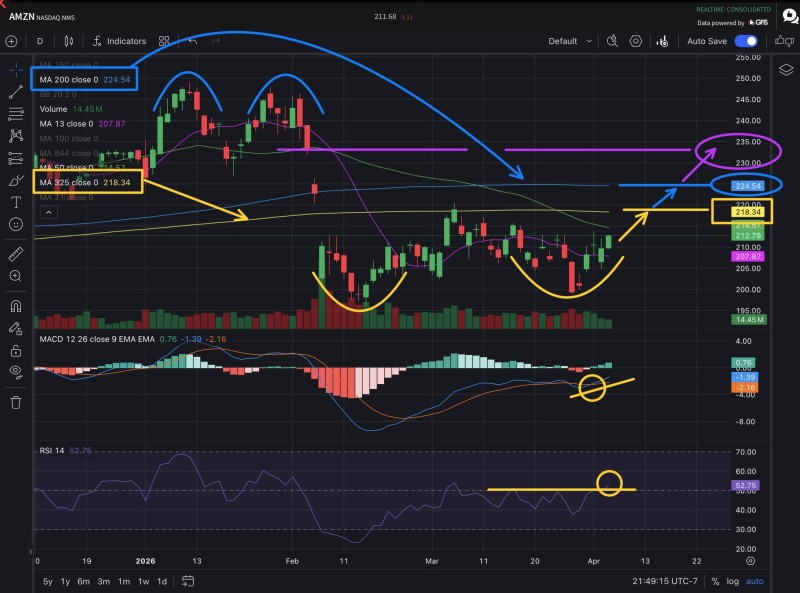
After forming a double top near the $245-$250 area, AMZN moved lower, breaking its previous bullish momentum and entering a corrective phase.
Selling pressure has weakened and buyers are stepping in at similar levels near the $200 zone, creating the base needed for a structural reversal.
However, instead of continuing downward, price stabilized and formed two distinct lows near the $200 zone. This creates a classic double bottom pattern, indicating that sellers are losing control and buyers are gaining a foothold at similar levels.
The shift from lower highs into a base formation suggests the market is no longer trending down - it is beginning to build a foundation for a potential move higher.
Where AMZN Structure Meets Resistance
As price rebounds from the second bottom, it is now approaching a cluster of resistance defined by key moving averages. The chart shows the 200-day moving average near $224 and another major level around $218 acting as barriers.
This aligns with broader technical behavior seen in AMZN, where price often reacts strongly around the 200-day moving average - a level widely tracked by institutions.
The recovery into this resistance zone is the first real test of whether the double bottom can evolve into a sustained upward move.
The recovery into this zone is critical. It represents the first genuine checkpoint for whether buyers have enough conviction to turn this base into something more meaningful.
AMZN Momentum Starts to Rebuild
Momentum indicators on the chart are beginning to turn upward, supporting the structural shift. The MACD is curling higher, while RSI is stabilizing near the mid-range rather than showing weakness.
This combination suggests that downside momentum has faded, and the market is entering a phase of potential expansion. AMZN Stock Forecast: AMZN Faces Key Levels Below $230 previously outlined how these zones continue to define the stock's direction - and current price action is now directly testing that thesis.
The price action is no longer impulsively bearish. It is stabilizing and preparing for a directional decision.
The 3 Targets Defining the Next AMZN Move
The setup now revolves around three key levels highlighted directly in the chart:
- $218 - first resistance level aligned with moving averages
- $224 - near the 200-day moving average
- $232 - next upside target if price breaks higher
If price clears these levels in sequence, the double bottom pattern would be confirmed, opening the door for further upside continuation.
These levels closely match broader resistance zones previously identified in AMZN, where price has struggled to sustain moves above the $223-$231 range. Meanwhile, broader setups like AMZN Gains Attention as Triangle Pattern Points to $321-$365 Target Zone show how consolidation structures can evolve into much larger moves once resistance is cleared.
For now, AMZN stock is no longer in a clear downtrend. It is stabilizing, forming a base, and testing whether buyers have enough strength to push the next leg higher.
 Alex Dudov