 Usman Salis

⬤ Amazon has drawn renewed attention after technical charts revealed a developing triangle pattern in AMZN shares. This structure has sparked interest around the possibility of Amazon reaching between $321.92 and $365.49 within the year. The setup shows a consolidation phase that could resolve with an upward breakout.
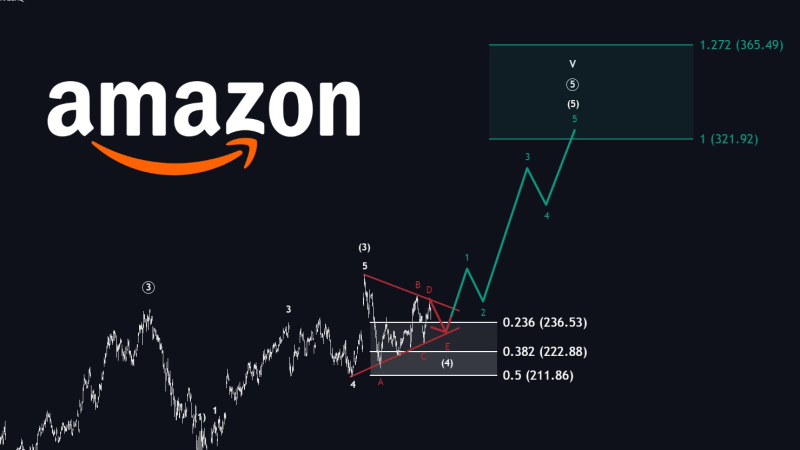
⬤ The chart displays a corrective triangle forming after an earlier rally, with price action tightening into a narrowing band. Key retracement levels include approximately $236.53 at the 0.236 mark, $222.88 at 0.382, and $211.86 at 0.5, which together establish the structure's lower boundary. From this base, projections point to renewed upside, with targets sitting near the 1.0 and 1.272 Fibonacci extensions.
⬤ The projected move toward the target zone would represent over 30 percent upside from recent levels. Wave labels on the chart suggest a continuation scenario if the triangle breaks higher. The analysis centers on price structure and measured extensions, highlighting how consolidation can set the stage for directional moves once resistance clears. Amazon's role as a heavyweight in US indices means technical setups like this can ripple beyond the individual stock, especially after prolonged consolidation. The outlined levels provide a clear roadmap for tracking how price action in one of the market's largest names might influence broader technology sector sentiment ahead.
 Usman Salis


