 Peter Smith

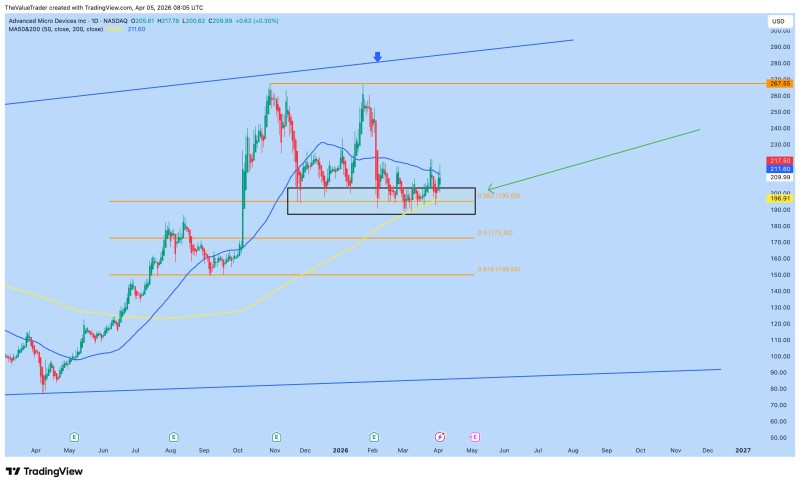
Advanced Micro Devices is currently holding just above its 0.382 Fibonacci retracement level near $195, with price action compressing into a tight range rather than breaking down. According to The Value Trader, this Fibonacci level is cleanly respected while the 200-day moving average has risen into the same region - creating a dual-layered support structure that technical traders closely monitor.
The 0.382 level is holding, and the 200-day moving average has moved up to meet price - this is exactly the kind of confluence that defines a technically significant zone.
AMD Stock Reacts at the $195 Fibonacci Zone
The 0.382 retracement near $195 has acted as a clear floor during AMD's recent pullback, with price repeatedly testing the lower boundary of this range without producing a definitive breakdown. This is not a bounce - it is a stabilization. The chart shows price holding inside a tight band above support, with no aggressive selling pressure pushing through the level.
This kind of behavior at a Fibonacci level is typically read as demand absorption. Sellers have been present, but buyers have consistently stepped in at the same area - the result being compression rather than continuation lower. For context on AMD's broader price history near these levels, see AMD Stock Builds Bullish Structure After Correction.
Price is not breaking down - it is compressing above support, and that behavioral shift matters more than any single candle at this stage.
AMD 200-Day Moving Average Reinforces the Support Structure
What makes this setup structurally notable is the dynamic role of the 200-day moving average. Rather than sitting far below price as a distant reference point, it has risen directly into the 0.382 zone. This means AMD is now resting on two overlapping support layers at once - a static Fibonacci level and a dynamic long-term moving average.
The alignment is not a forecast. It is an observation about how precisely price is interacting with these levels at the same time. For traders who follow AMD's technical patterns, this mirrors prior consolidation episodes covered in AMD Holds Near $236 as Stock Consolidates After 15% Rally.
AMD Consolidation Zone - What the Chart Actually Shows
There are no directional targets or explicit breakout signals in the source analysis. The setup is defined entirely by structure - where price is, what it is resting on, and how it is behaving. That restraint is worth noting. Confluence setups like this one create conditions for a move, but they do not determine its direction.
The current AMD technical picture, as defined by this analysis, comes down to three elements:
- A 0.382 Fibonacci retracement near $195 acting as active support
- A rising 200-day moving average converging into the same zone
- Price consolidating above the level with no confirmed breakdown
When price consolidates above a confluence zone rather than breaking through it, that compression itself becomes information - the structure is being tested and holding.
AMD is neither trending up nor collapsing. It is holding a technically precise area where two major reference points have aligned. Whether that produces a base for continuation or simply delays further downside depends on how price resolves from here. What the chart makes clear is that the $195 region is not arbitrary - it is where structure is being decided. More context on AMD's recent price trajectory is available in AMD Stock Near $221 as Breakout Level Approaches an Earnings Gap.
 Peter Smith


