 Saad Ullah

⬤ Advanced Micro Devices kicked off the session with serious upside energy, climbing higher early on before cooling off into the close. The stock put together a solid intraday run but didn't quite seal the deal with a bullish engulfing candle on the daily chart. Price stalled just below the upper resistance zone after testing higher ground—looks more like a breather than any real reversal signal.
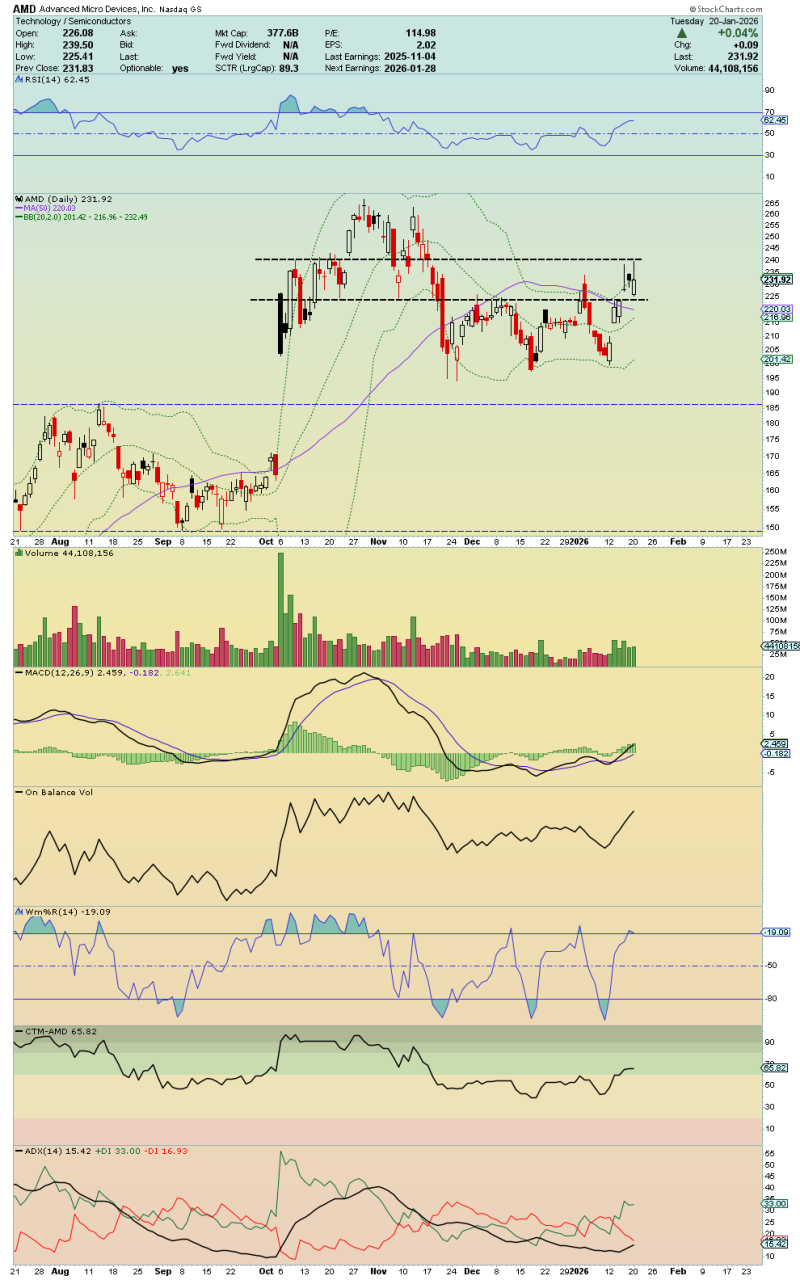
⬤ From a technical standpoint, AMD's structure still looks pretty healthy after last week's climb. Price is sitting comfortably above the rising 20-day moving average, which is now acting as support around the low-$220s. Bollinger Bands are moderately stretched, showing some volatility without going overboard. RSI's hovering near the low-60s—solid momentum territory without being overbought. That's textbook consolidation after a strong move up.
⬤ All eyes are on the $236–$238 resistance zone now. That's where sellers showed up before, and it's clearly marked on the chart as a supply area worth watching. If AMD can push through and hold above that level, the next target becomes the $241 gap—a magnet for price action when momentum's really cooking. One catch though: volume's been lighter than it was during earlier impulse legs. That means we'd need to see buying interest pick up before any real breakout attempt has legs. Until then, AMD's trading range-bound in the upper part of its recent structure.
⬤ What happens here matters beyond just AMD. The stock tends to move with the broader semiconductor sector, especially the big-cap chip names. Consolidation after a strong rally usually means digestion, not exhaustion—especially when moving averages keep trending higher. How AMD handles the $236–$238 zone and whether volume shows up on the next push could set the tone for semiconductor stocks and the wider tech trade in the days ahead.
 Saad Ullah


