Saad Ullah

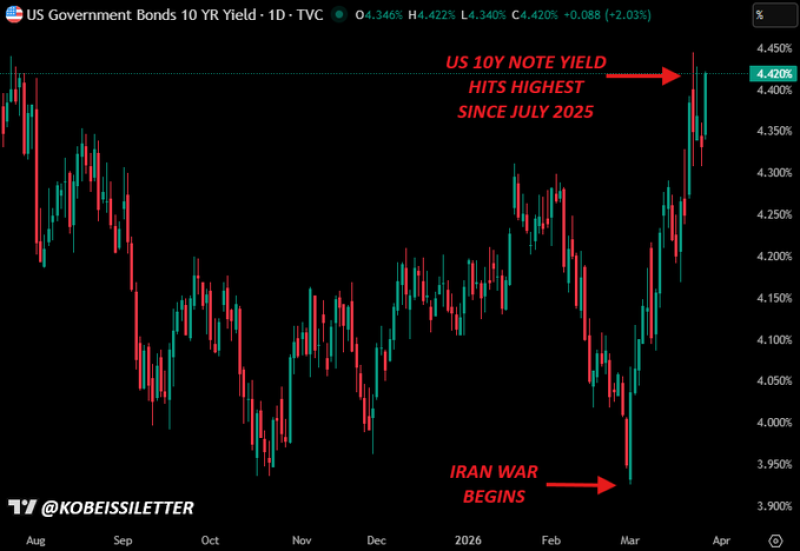
Two things happened at roughly the same time this week, and the bond market noticed both. President Trump paused planned action against Iranian energy infrastructure for 10 days. And the US 10-year yield crossed 4.40%. Whether that overlap is coincidence or cause-and-effect, traders are paying attention to what it says about the current risk environment.
The Kobeissi Letter flagged the timing, and the chart structure behind it adds weight to the concern. This isn't a market sitting in clean consolidation. It's one showing the early signs of a structure that's starting to lean.
Bond Yields at 4.40% as SPY Structure Shifts From Uptrend to Lower Highs
The chart tells a familiar story in a new context. After a period of upward movement, price action begins rolling over, forming lower highs into the most recent data. That's a meaningful shift from a structure that had previously favored continuation.
The pause in geopolitical escalation coincided with a move higher in bond yields, reinforcing that financial conditions are tightening and market sensitivity to external signals is increasing.
Momentum confirms the shift. MACD has crossed lower and continues to expand in negative territory. RSI is trending toward the lower range, suggesting weakening rather than outright capitulation. That distinction matters: weakening momentum with room still to fall is often more dangerous than a deeply oversold reading, because there's no technical floor to bounce from yet.
SPY is already compressing below its 200-day MA near $661, and rising yields don't make that setup any easier to resolve to the upside.
Bond Market Compression Points to 2-Step Support Structure Below Current Levels
The current level is holding, but the way it's holding is the problem. Repeated tests of the same support zone absorb liquidity each time, and without a strong bounce following those tests, the balance gradually tilts toward breakdown risk.
Below the immediate zone, the chart points to a secondary demand layer aligned with a longer-term moving average. That creates a two-step structure: immediate support under pressure, a deeper demand zone below it, and limited signs of recovery in between.
- Price forming lower highs into current support
- MACD expanding lower, RSI trending down without reaching extremes
- Immediate support being tested repeatedly without a clean bounce
- Secondary demand zone below as the next reference point
- Geopolitical pause adding external pressure to an already fragile structure
The $657 level on SPY, where the 200-day MA previously acted as resistance, sits well overhead from current levels, reinforcing how much ground bulls would need to reclaim to restore the prior structure.
Policy Signals and Rising Yields Keep Market Resolution Delayed
That's the core tension right now. Price is neither reclaiming higher levels nor breaking decisively lower. It's pinned near support with declining momentum and an external backdrop that isn't offering much relief. The Iran pause removes one near-term tail risk, but it doesn't resolve the underlying pressure building in rates and risk appetite.
SPY's earlier inverse head and shoulders setup that targeted $680 feels distant from where things stand now. That pattern required a clean hold and expansion from support. What the market is showing instead is compression without conviction.
The level is holding. The balance is not neutral. And with yields at 4.40% and geopolitical signals still shifting, the next directional move is building pressure whether the chart breaks this week or next.
 Saad Ullah