 Saad Ullah

The S&P 500 proxy has reached a critical technical crossroads. SPY is trading just below its widely-watched 200-day moving average near 661, while simultaneously pressing against a descending trendline that has been capping every recent rally attempt. According to Banana3, this convergence of structure and momentum is setting up a potential directional move that traders shouldn't ignore.
SPY's Chart Shows Where Structure Meets Pressure
The transition from uptrend to corrective phase is written all over the chart. A descending trendline continues to define a series of lower highs, keeping short-term bearish structure firmly in place — and the 200-day moving average around 661 is acting as resistance, not support.
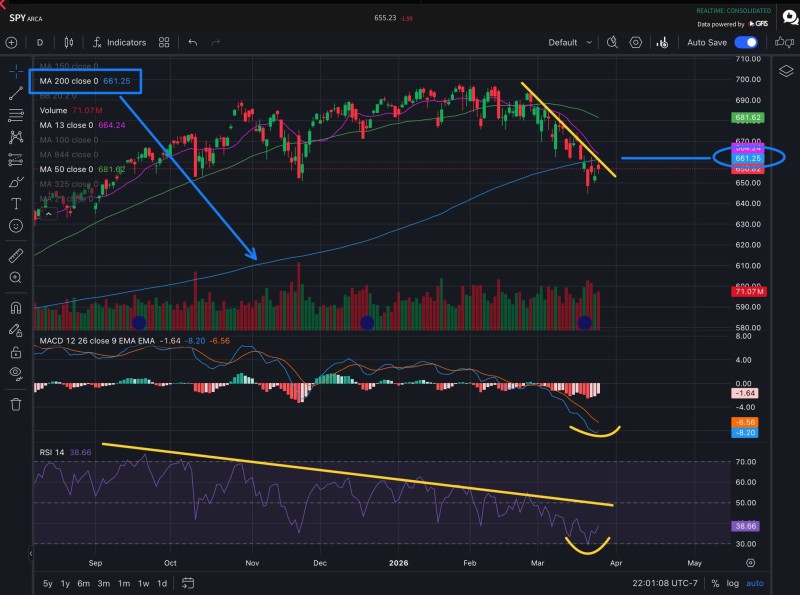
What makes this setup particularly interesting is the compression happening right now:
⬤ Price is coiling tightly beneath the 200DMA
⬤ Lower highs continue to develop along the descending trendline
⬤ Candle ranges are shrinking, pointing to reduced volatility
As Banana3 put it, "this convergence creates a moment where structure and momentum are aligning." Markets don't stay coiled forever — and this type of compression often precedes a sharp move in one direction. Similar setups have shown up recently in SPY faces $657 200-day MA test as 8-day EMA rejections mount, where repeated failures near key moving averages kept reinforcing short-term downside pressure.
Momentum Indicators Are Quietly Rebuilding Beneath SPY's Surface
The momentum picture is starting to shift, even if price hasn't confirmed it yet. RSI reached near-oversold territory during the recent leg lower and has started to bounce — it's no longer falling, which is the first sign of a potential reset. MACD is showing a similar story, with the lines curling upward after an extended bearish phase. It's not a confirmed bullish crossover yet, but the early turn is visible.
When momentum stops deteriorating near a major level like the 200DMA, it usually means the market is preparing for a decision rather than drifting lower.
"The RSI reset and MACD curl are exactly the kind of quiet signals that tend to show up before a sharp reaction," Banana3 noted. This kind of momentum reset ahead of a key level is worth paying attention to. It played a defining role in SPY drops below 200-day SMA as a pattern that predicted 5 major market crashes reappears, where positioning around the 200DMA became the central factor in what came next.
The Break Above 661 That Could Change SPY's Entire Picture
The technical trigger here is straightforward: a move above the descending trendline combined with a reclaim of the 200DMA would mark a structural shift. If SPY clears roughly 661 and holds, the moving average flips back into support — and the next logical target becomes the 50-day moving average near 680, visible on the chart as the next major resistance zone.
That scenario lines up with what was outlined in SPY inverse head & shoulders forms, eyes 680 level, where reclaiming key moving averages opened the path toward higher resistance. But the chart hasn't confirmed that move yet. Price is still pinned below both the trendline and the 200DMA.
As Banana3 summarized, "SPY is not breaking down — but it is not breaking out either." The 200-day moving average is acting as a ceiling rather than a floor right now, and the next move hinges entirely on whether price can reclaim that level and build momentum above it — or stay trapped beneath resistance just a little longer.
 Saad Ullah


