 Usman Salis
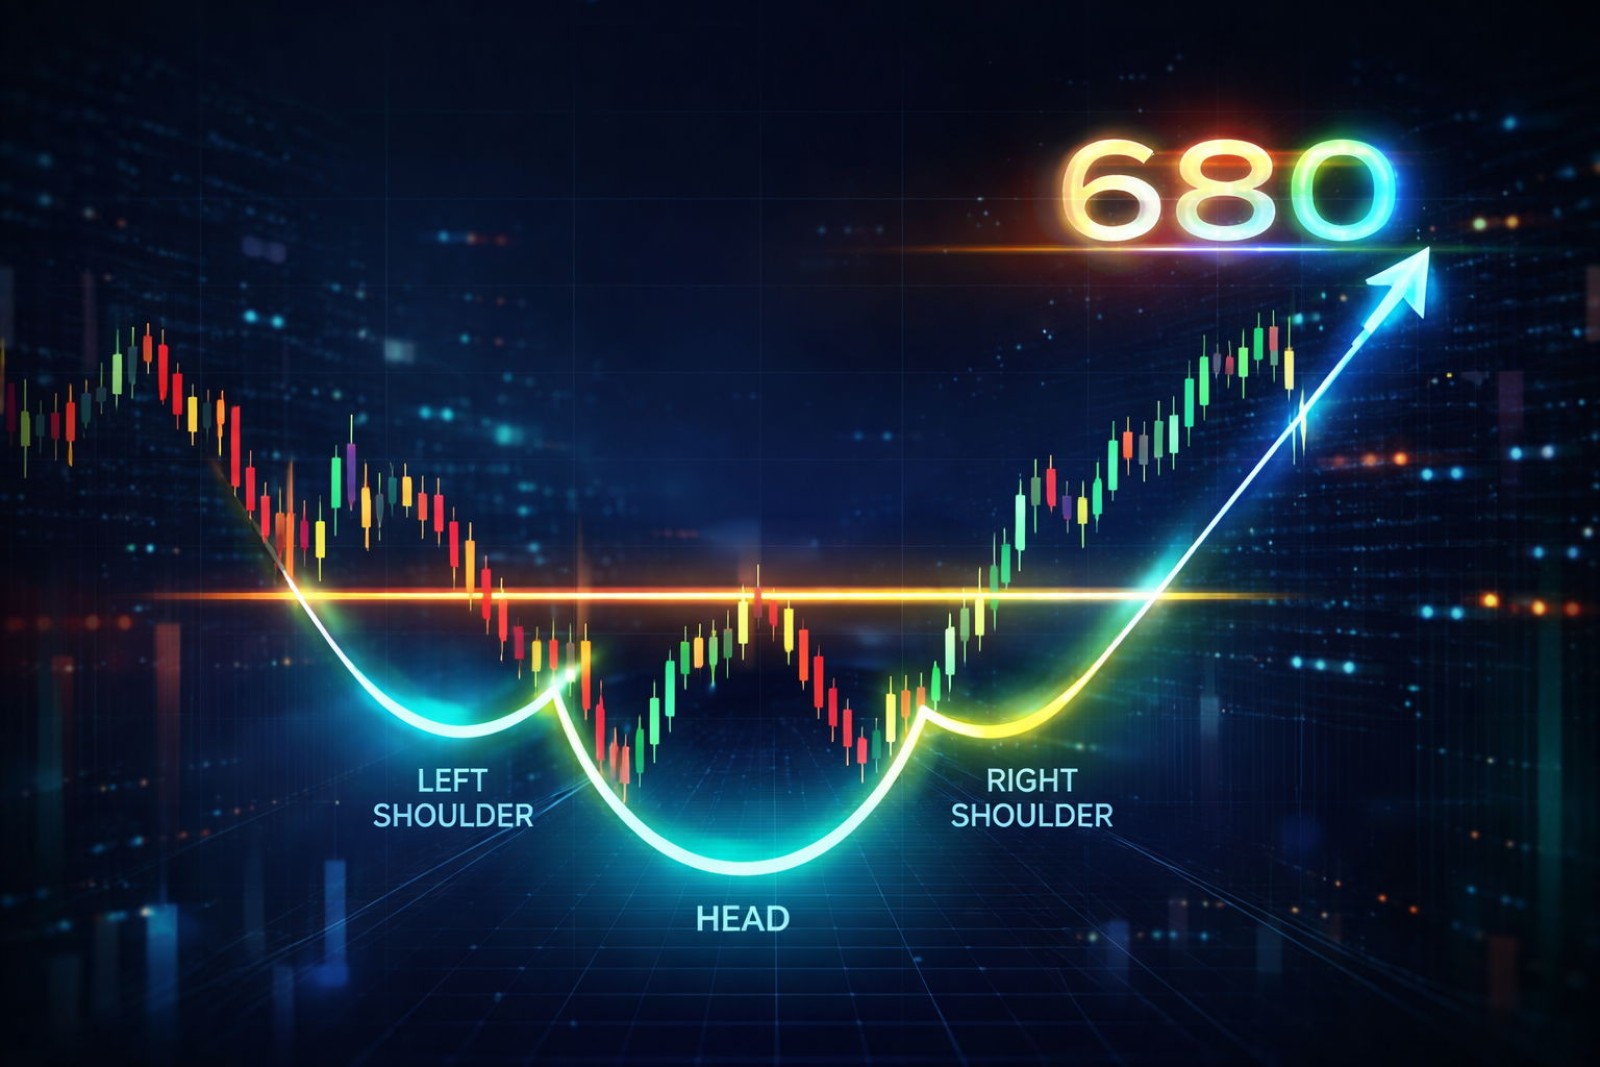
SPY is flashing a classic reversal signal at a pivotal moment. As markets push through a corrective phase, traders are watching a developing inverse head and shoulders pattern that could define the next major directional move. The setup hinges on a critical support level - one that has already been tested and defended. If the structure confirms, the 680 level becomes the immediate technical target.
False Breakdown Creates the Pattern's Head at Key Support
The setup, flagged by The Swing Trader, began with a sharp false breakdown below a "must hold" support zone. Price dipped aggressively beneath that level, shook out weak hands, then snapped back quickly - textbook behavior for the "head" of this pattern.
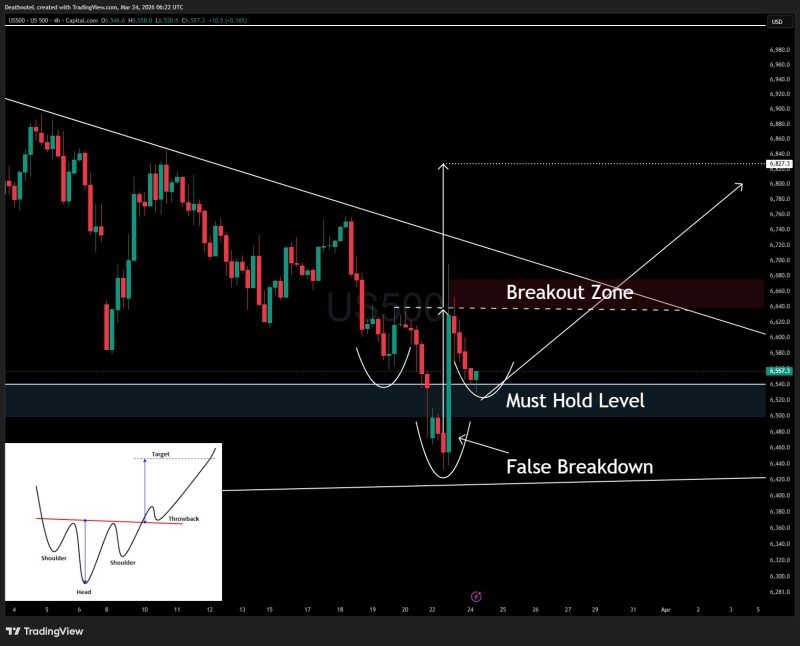
Both shoulders are forming around the same support region, consistent with liquidity grabs that precede reversals. The right shoulder is still developing, keeping the setup conditional for now. For context on how SPY held similar levels before, see SPY breakout confirmation analysis, where volume backing a key level helped sustain bullish momentum.
SPY Needs a Trendline Break to Target the 680 Resistance Zone
A descending trendline sits above current price, acting as the defined breakout zone. If SPY completes the right shoulder and closes above that resistance, the projected move targets 680 - the level referenced in the original setup. Failure to hold support, however, invalidates the pattern and opens downside risk. Broader context is important here: as covered in the S&P 500 correction phase analysis, price pulled back toward the mid-6500 range from January 2026 highs, creating the exact corrective backdrop where this pattern is taking shape.
The stakes are elevated given where this setup sits in the broader cycle. Markets are searching for direction after extended consolidation, and technical structures like this can spark momentum shifts when confirmed. Historically, similar conditions have tested sentiment hard. The SPY below 50-day moving average report showed how breaking key support triggered volatility and shifted trader positioning sharply - a reminder of what a failed pattern here could mean.
 Usman Salis


