 Marina Lyubimova

The S&P 500 proxy is approaching a decisive technical moment as SPY stock pushes back into a major resistance zone. After a sharp drop from highs near $697.84, price has rebounded toward the 200-day moving average at $662.57. As Esther & Michael noted, buyers have stepped into the market over the last three sessions - and the chart supports that view with elevated trading volume during the rebound.
The SPY Bounce That Ran Into Overhead Pressure
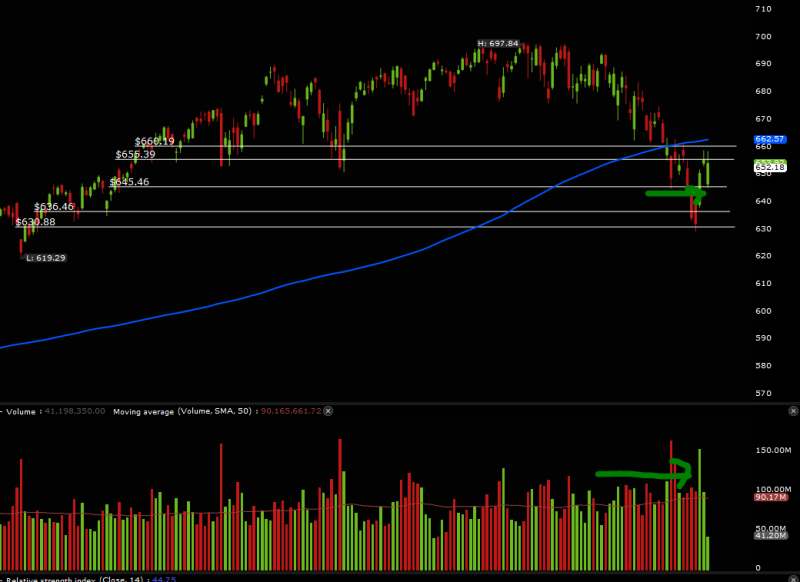
The chart shows SPY shifting from a prior advance into a corrective phase. After printing a high near $697.84, the ETF rolled over and traded down toward the $630.88-$636.46 support area before stabilizing. That selloff broke the smoother rhythm of the earlier uptrend and turned attention to whether buyers would defend the lower band of support.
SPY is not simply bouncing - it is testing a layered ceiling where prior support levels have flipped into resistance just beneath the 200-day moving average.
The rebound that followed has been meaningful - but it has not yet cleared the most important technical barrier. Price has pushed back into the $645.46, $655.39, and $660.19 zone, where several prior reference levels now cluster just beneath the 200-day moving average. SPY is not simply bouncing - it is testing a layered ceiling.
Why the SPY 200-Day Average Is Doing the Heavy Lifting
The 200-day moving average at $662.57 is the dominant feature on this chart. SPY is approaching it from below, which usually makes the level more difficult to reclaim on a first attempt. The setup is made even more important by the fact that the average sits just above former support levels that can now act as resistance.
That creates a narrow but meaningful band of pressure. If buyers can push SPY through this area and hold it, the tone of the chart changes quickly. If they fail, the current move risks becoming another lower high inside a broader pullback.
SPY Slips Below 200-Day Moving Average as S&P 500 Structure Breaks Down documented the initial break below this level, showing how quickly the structure shifted once the 200DMA gave way - which is exactly why reclaiming it from below is proving this difficult.
Volume Is Confirming SPY Buyer Interest, Not Resolution
The other major signal on the chart is volume. The past few sessions show heavier participation as SPY bounced off the lows, with one green bar standing out as a clear spike above the recent norm. That matters because it suggests the rebound is being supported by active buying rather than drifting higher on weak liquidity.
High volume at resistance can cut both ways - it can confirm accumulation if price breaks through, or mark a zone where sellers are willing to re-enter in size.
SPY Compresses Below 200DMA Near 661 as Downtrend Tightens captured the compression phase just before this rebound attempt, providing useful context for how the current move fits into the broader pattern of lower highs forming beneath the moving average. SPY Faces $657 200-Day MA Test as 8-Day EMA Rejections Mount reinforces why each test of this zone has been closely watched - repeated rejections at or near the 200DMA have been defining the structure of the entire pullback.
 Marina Lyubimova


