 Usman Salis
The S&P 500 has crossed a critical technical threshold, slipping beneath its 200-day moving average - a level widely viewed as a key indicator of long-term trend direction. As Aksel Kibar, CMT noted, bulls now face a clear test: reclaim the level quickly or risk the market drifting into a more sustained downtrend.
The S&P 500 Breakdown That Shifted Market Structure
The chart shows a clear transition from a prior uptrend into weakening structure.
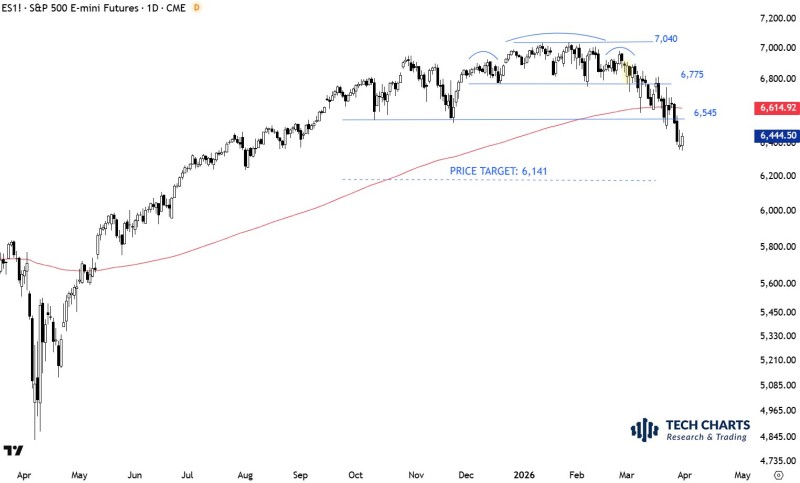
After peaking near the 7,040 area, price action began forming lower highs, signaling that buying pressure was fading.
The longer price remains below the 200-day moving average, the more it reinforces the bearish signal. In technical analysis, time spent below such a key level often matters as much as the initial break itself.
A key inflection came as the index broke below the 6,775 level - a previously established support zone. Once this level failed, downside momentum accelerated, pushing the index toward the 6,545 region and briefly below it.
At the same time, the 200-day moving average - represented by the rising red line - was lost. This level had acted as dynamic support throughout the broader uptrend, and its breakdown marks a notable technical deterioration.
Where SPY Buyers Are Losing Control
The price structure now reflects a shift in control:
- Lower highs forming after the 7,040 peak
- Breakdown below the 6,775 support level
- Continued pressure toward the 6,545 zone
This sequence highlights a transition away from a stable bullish structure. Attempts to stabilize have so far lacked strength, with price failing to regain prior support levels.
A move back above the 200-day moving average would signal renewed strength and potentially invalidate the breakdown.
Broader market context adds weight to this reading. 115+ S&P 500 Stocks Crashed 7% While SPY Trades Near Record Highs - a divergence that suggested internal weakness long before the index-level breakdown became visible.
The 200-Day Level That Defines the Next SPY Move
The 200-day moving average is now the defining line for SPY and the broader S&P 500. If price continues to trade below this level, the chart suggests further downside risk, with a projected move toward the 6,141 area - marked as the next potential target.
This places the S&P 500 at a critical juncture, where structure, momentum, and long-term trend signals are all aligned around one key level.
For longer-term context, SPY Cycle Watch: S&P 500 ETF Approaches End of 17-Year Bull Phase examines whether this breakdown fits into a larger cyclical topping pattern. Meanwhile, SPX at 6,624: S&P 500 Eyes Pullback Before Mid-Year Rebound outlines a potential recovery scenario if support holds and buyers step in.
 Usman Salis


