 Alex Dudov

SPY stock delivered a sharp reversal, closing with a bullish engulfing candle after a volatile session. According to MentoviaX, the move carried real weight given the prior downside pressure - though price still ran into rejection at the 200-day moving average, leaving the broader S&P 500 structure in a delicate spot.
The Candle That Changed the Session
The chart highlights a powerful bullish engulfing candle on the daily timeframe, where price fully reversed the prior session's range and closed near its highs.
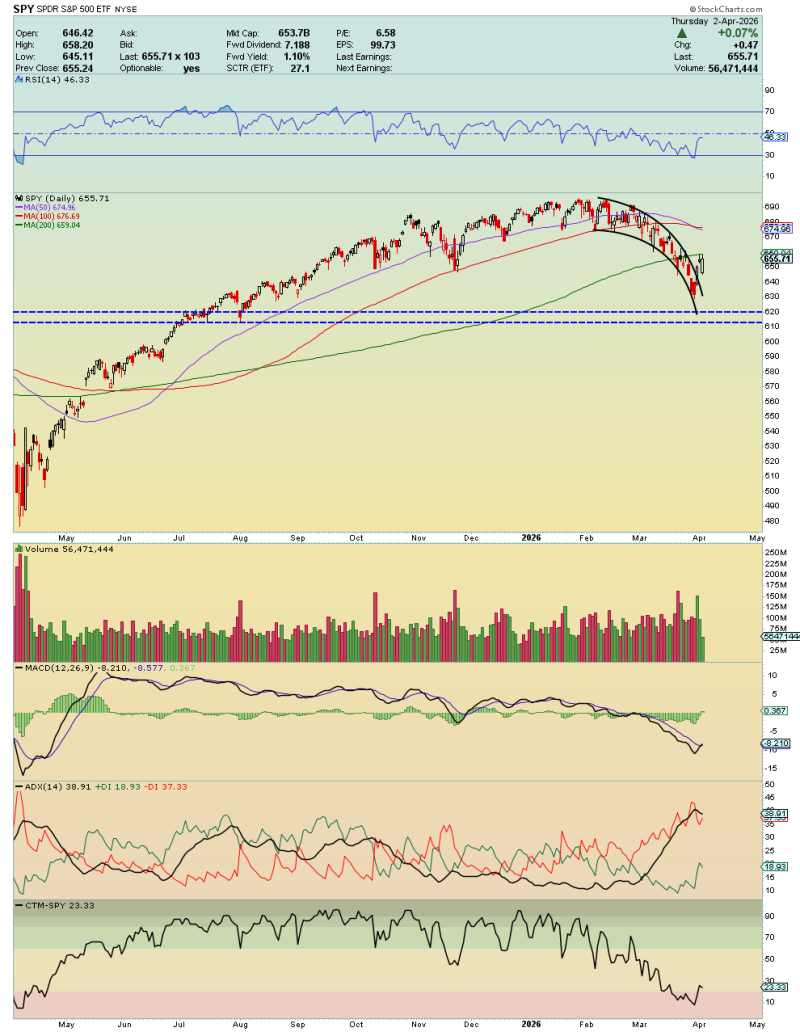
This kind of candle typically reflects aggressive buying stepping in after a sharp selloff. Here, the move followed a steep decline that pushed SPY into the $620-$630 region, before a rapid rebound carried price back toward the mid-$650s.
The strength of the candle signals a shift in short-term momentum - but not necessarily a confirmed trend reversal.
Why the 200-Day Moving Average Still Caps SPY at $659-$662
Despite the strong bounce, SPY remains below the 200-day moving average, which sits just above current price in the $659-$662 area.
The chart shows price reacting directly into this level and stalling out. That fits with the broader SPY technical picture, where the 200-day moving average has become a defining resistance zone following recent weakness.
In practical terms, this keeps the S&P 500 in a transitional state - rallies happen, but structural resistance continues to limit how far they run.
A Recovery That Hasn't Reclaimed Structure Yet
While the engulfing candle stands out, the overall structure hasn't really improved. Price had already broken down from a higher range and slipped below key moving averages. The current bounce, sharp as it is, hasn't reclaimed any of those levels.
This is a market that keeps bouncing into resistance - rallies look promising, then fade before anything confirms.
That pattern has showed up repeatedly in recent SPY price action, where strong intraday moves failed to hold above key zones and the market drifted back into consolidation. The result is a setup caught between recovery attempts and persistent underlying weakness.
The $661-$662 Zone That Decides SPY's Next Move
Everything now points to whether SPY can push through the $661-$662 area and reclaim the 200-day moving average.
A clean break above that zone would mark a meaningful shift - momentum would tilt back toward buyers and open up room for follow-through. Without it, the current dynamic holds: sharp reversals that run into resistance and go nowhere.
When price keeps reacting at the same moving average without breaking through, the level is telling you something. The 200-day isn't just resistance here - it's the line that separates recovery from continuation of weakness.
That dynamic has defined several recent SPY setups, where reactions at key moving averages set the tone for the next directional leg.
For now, SPY has shown strength - but only within the constraints of a structure that hasn't turned yet.
 Alex Dudov


