 Victoria Bazir

⬤ SPY hit a short-term pullback after its recent rally, sliding into a well-defined support zone on the 45-minute chart. The retreat followed a series of higher highs that topped out near the recent range before losing steam. Price then worked its way lower in controlled fashion, landing in the blue box region between roughly $666 and $674—a corrective target zone flagged ahead of time on the chart.
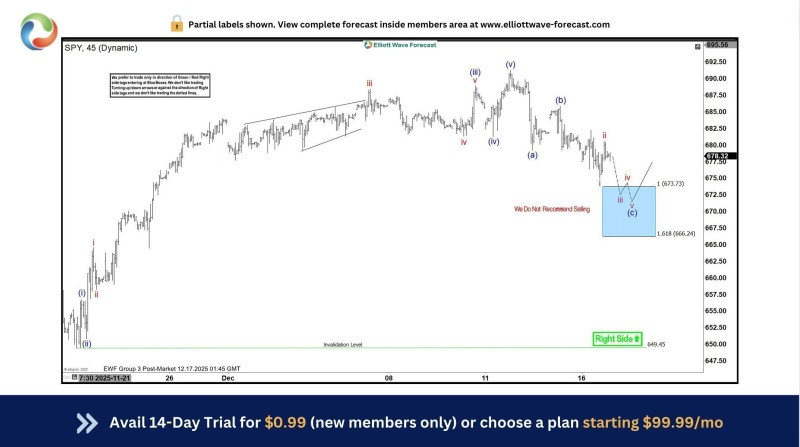
⬤ The pullback landed right in the blue box area pinpointed by Elliott Wave analysis. The chart shows the decline playing out as a corrective move, not an impulsive breakdown. Wave labeling suggests this short-term correction is wrapping up. The analysis specifically calls out that this zone isn't meant for selling, reinforcing the idea that this dip is just a breather in the uptrend, not a change in direction.
⬤ Structurally, SPY's still sitting above its key invalidation mark near $649, keeping the bigger bullish picture intact. Price action inside the support box looks like it's stabilizing rather than accelerating lower—classic signs of a correction running its course. The Elliott Wave count frames this pullback as part of wave ((c)) in a larger sequence, leaving room for upside to kick back in if support continues holding firm.
⬤ This move matters for the broader market since SPY's the go-to gauge for U.S. equity performance. A measured pullback into a pre-mapped support zone shows the market's correcting through structure, not chaotic selling. With downside risk clearly marked by the invalidation level and price responding right at a technical sweet spot, the chart signals a shift from short-term weakness toward stabilization. How SPY behaves from here will set the tone for volatility and direction across the wider equity market in the days ahead.
 Victoria Bazir


