 Saad Ullah

A highly unusual pattern is developing in the S&P 500. As Mike Investing noted, the market is one session away from recording 10 straight down Thursdays - an event that would mark a new historical extreme. The chart underscores just how rare this setup is, with prior streaks typically peaking around nine sessions and occurring only sporadically over nearly a century.
A Rare SPY Stock Streak Pushing Historical Limits
The chart tracks Thursday losing streaks for the S&P 500 dating back to 1928, revealing a market that rarely sustains downside on the same weekday for long.
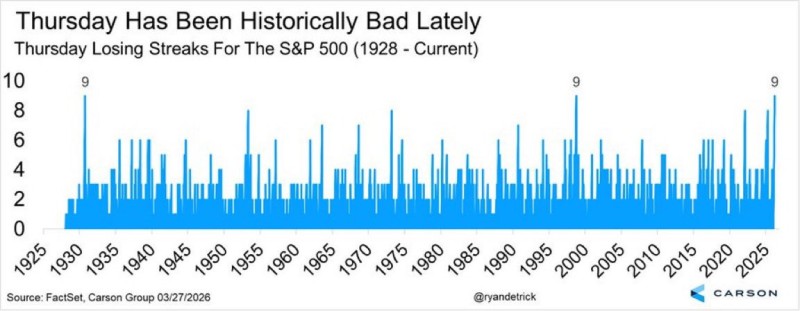
Most sequences cluster between two and five consecutive losses, with occasional spikes reaching higher - but those have historically been brief.
The market is one session away from recording 10 straight down Thursdays - an event that would mark a new historical extreme
SPY slipping below the 200-Day Moving Average reinforces how unusual the current moment is. A move to 10 consecutive red Thursdays would exceed all prior readings, placing SPY stock behavior outside the normal historical range.
This is not about magnitude of declines, but persistence. The consistency of red Thursdays suggests a repeating short-term rhythm rather than isolated volatility.
When Repetition Becomes Structure in the S&P 500
From a technical analysis perspective, repeated weakness on a specific day can evolve into a structural pattern. Traders begin to anticipate the behavior, reinforcing it through positioning and execution.
This kind of repetition doesn't define the broader S&P 500 trend on its own, but it can shape short-term behavior and influence how traders manage risk within the weekly cycle
The current setup reflects a market that struggles to carry strength through the week, with downside pressure repeatedly emerging at the same interval. Key takeaways from the chart:
- The current streak is approaching a record level of 10 consecutive losses
- Historical peaks have topped out near nine occurrences
- Most streaks fade quickly, making extended runs highly unusual
SPY compressing below the 200DMA near 661 as the downtrend tightens adds another layer to this picture - the Thursday pattern doesn't exist in isolation, but as part of a broader deterioration in market structure.
A Signal of Weakness in the SPY Stock Trend
While the chart does not show price levels or indicators like the 200-day moving average, it reveals something equally important: consistency in selling pressure. Persistent one-day weakness often aligns with markets that fail to sustain upward momentum. Instead of building continuation, rallies tend to stall and rotate into selling phases at predictable intervals.
Repeated failures near resistance and trendlines have reinforced short-term pressure dynamics - and the Thursday pattern fits directly into that narrative
Recent S&P 500 technical analysis has already highlighted fragile structure in SPY. Breakdowns below key long-term indicators have pointed to weakening conditions in the broader stock market trend, and SPY futures reversing losses and turning green at 6,415 shows just how volatile intraday swings have become within this environment.
If the streak extends, it won't just mark a statistical milestone. It will confirm a pattern of behavior that traders may increasingly anticipate - turning a historical anomaly into an actionable rhythm.
 Saad Ullah


