 Alex Dudov

A rapid intraday turnaround in U.S. equity futures caught the attention of market watchers on Monday. As The Kobeissi Letter reported, SPY futures erased all session losses and moved back into positive territory, highlighting just how quickly the stock market trend can shift within a single trading day.
The chart told a straightforward story. Price initially declined through a sequence of red candles, pushing futures toward the 6,360 area before buyers stepped in aggressively and drove a sharp recovery back above 6,400.
S&P 500 Futures Drop to 6,360 Before Buyers Respond
The early part of the session showed clear selling pressure. Futures printed lower lows as bearish momentum built, and price moved away from the prior session's close without any meaningful support reaction.
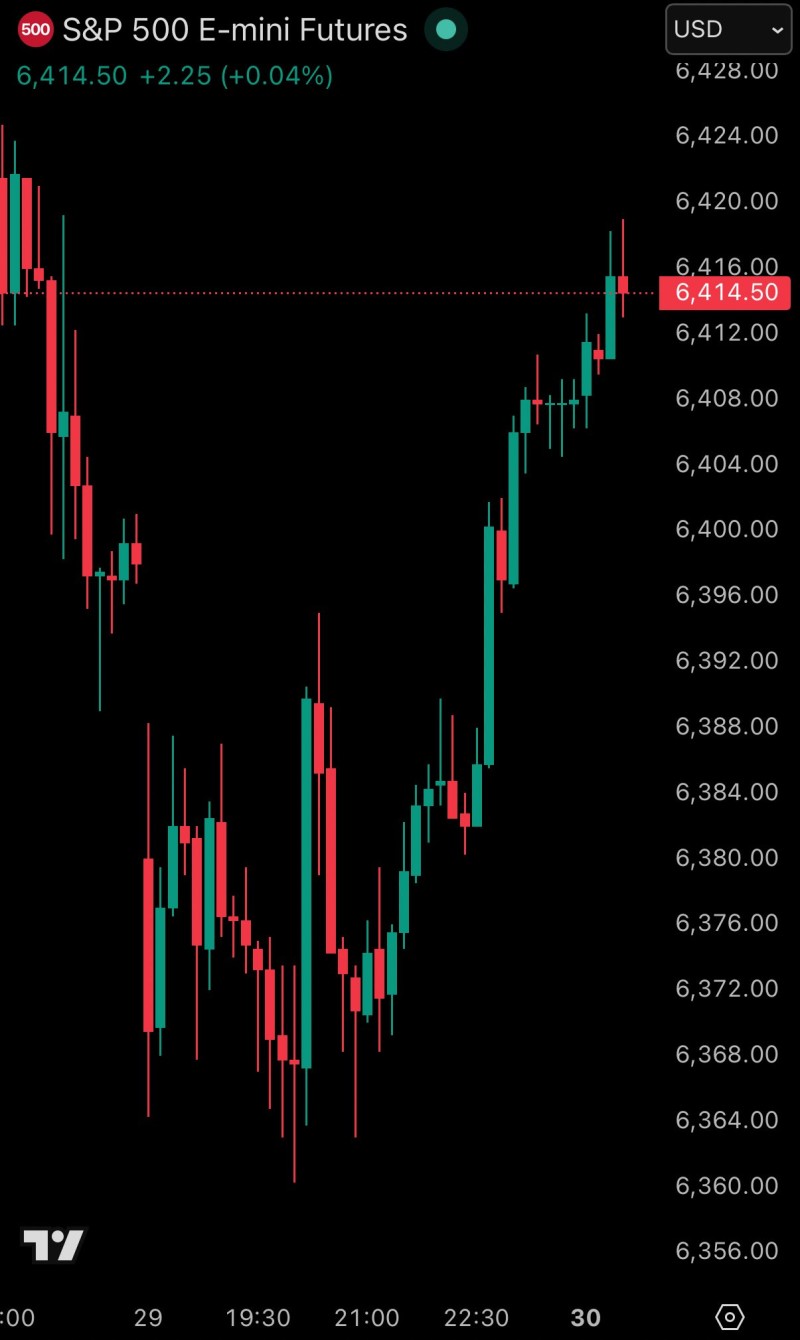
That changed at the 6,360 zone. Buyers absorbed the downside move and began pushing back, generating a sequence of green candles that reclaimed lost ground rapidly. The recovery had a V-shaped character, suggesting the initial decline was treated as an opportunity rather than the start of a deeper move.
The structure shifted into a short-term recovery phase as buyers formed higher lows and reclaimed the 6,400 level.
This kind of intraday behavior is consistent with patterns observed in S&P 500 technical analysis, where sharp pullbacks within larger structures often resolve into continuation moves rather than sustained breakdowns.
SPY Price Action Stalls Near 6,415 After Recovery
Despite the recovery, the most recent candles near 6,415 showed signs of hesitation. Upper wicks and smaller candle bodies pointed to buying pressure meeting resistance at local highs.
The short-term picture at that point included three key elements:
- Price reclaimed the 6,400 level after fully erasing the earlier decline
- Upside momentum was slowing near recent highs
- Candle structure suggested a pause rather than a clean continuation
This kind of behavior is worth watching closely. It does not erase the bullish signal from the reversal itself, but it does raise questions about whether follow-through will develop or whether price returns to consolidation. For broader context, asset manager positioning has been a recurring factor in recent S&P 500 volatility.
What Traders Are Watching Next in SPY Futures
The key level to monitor is 6,400. Holding above it keeps the short-term structure in favor of the bulls and opens the door to a push toward higher resistance zones. A failure to sustain the recovery, by contrast, would shift focus back to the 6,360 area and raise the possibility of another test of that support.
The session demonstrated one of the more consistent dynamics in U.S. equity futures: sentiment can pivot sharply within hours, and the technical picture can look very different by the close than it did at the open.
 Alex Dudov


