Usman Salis

The S&P 500 is flashing early technical warning signs after slipping below its 20-week simple moving average - a line that has long served as one of the market's most reliable trend gauges. It is the kind of move that does not always lead to a crash, but it has a way of making traders sit up straighter.
According to Bitcoinsensus, the last time SPY lost this level, a sharp market decline followed shortly after. That historical precedent is back in focus, and the setup looks uncomfortably familiar.
A Trendline That No Longer Holds on SPY
For most of the observed period, price held cleanly above the 20-week moving average. The average acted as dynamic support, quietly guiding the broader market higher without much fanfare. It was the kind of stability that makes the current breakdown feel more significant by contrast.
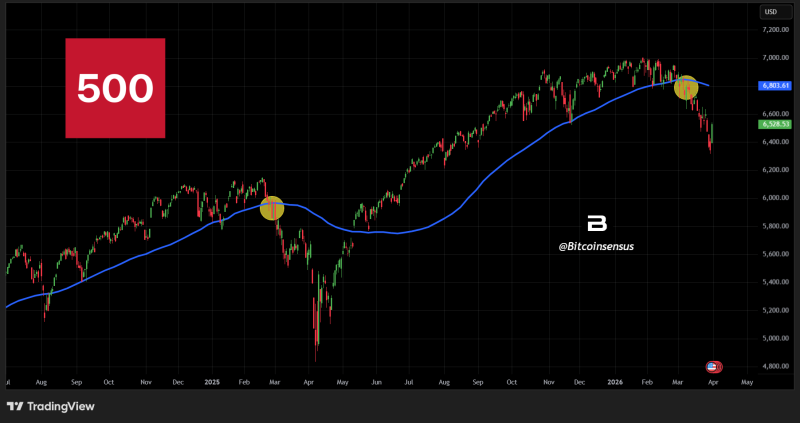
The last time SPY broke below the 20-week SMA, what followed was not a slow grind - it was a sharp move that caught many off guard.
That behavior has now shifted. Price has broken below the moving average, signaling a loss of structural support and pointing toward a potential transition in the broader S&P 500 SPY stock market trend. The chart does not lie about what has changed.
From Support to Resistance - SPY's Fragile Positioning
The most recent price action tells a pointed story. There is a clearly defined zone where SPY attempted to stabilize near the 20-week SMA - and failed. What used to absorb selling pressure is now pushing back against buyers. That kind of role reversal tends to matter.
When a level stops acting as support and begins acting as resistance, it is usually a sign that the balance of power in the market has shifted - even if the bigger trend has not fully reversed yet.
A similar setup appeared earlier in the chart, and it led to a sharp drawdown before any meaningful recovery. That historical reference is part of why traders are watching this level closely now. As observed across SPY's 200-day MA rejection patterns, losing key moving averages tends to open the door to broader momentum shifts.
SPY Structure Shows Early Signs of Technical Weakness
From a technical analysis standpoint, the structure is beginning to unravel at the edges. Price is no longer anchored above its trend-defining average, and recent downside moves are carrying more force than typical pullbacks in a healthy uptrend. The chart is starting to tell a different story than it was three months ago.
The combination worth watching right now:
- A clean break below the 20-week moving average
- A failed attempt to reclaim and stabilize at that level
- Increasing downside momentum after the rejection
Together, these elements point to weakening buyer control - even if a full trend reversal has not yet been confirmed. The S&P 500 Elliott Wave correction risk signals building in parallel make this structural softening harder to ignore.
A Signal, Not a Guarantee - But One Worth Watching
Outcomes are not predetermined. History rhymes, but it does not always repeat - what matters is how price behaves around this level in the sessions ahead.
To be fair, a break below the 20-week SMA is a signal, not a verdict. Markets have broken below this average before, stabilized, and gone on to reclaim it - resuming their uptrend as if nothing happened. The setup alone does not define the outcome.
But the key dynamic is clear: SPY is now trading below a level that previously defined strength. Whether this turns into a deeper correction or a temporary shakeout will come down to how price behaves in the coming sessions. Right now, the burden of proof sits with the bulls.
 Usman Salis