 Marina Lyubimova
● According to Barchart, the S&P 500 ETF is headed for its first close below the 50-day moving average since April. This breaks a remarkably long stretch of staying above this widely-watched technical indicator—the third-longest run since 1990.
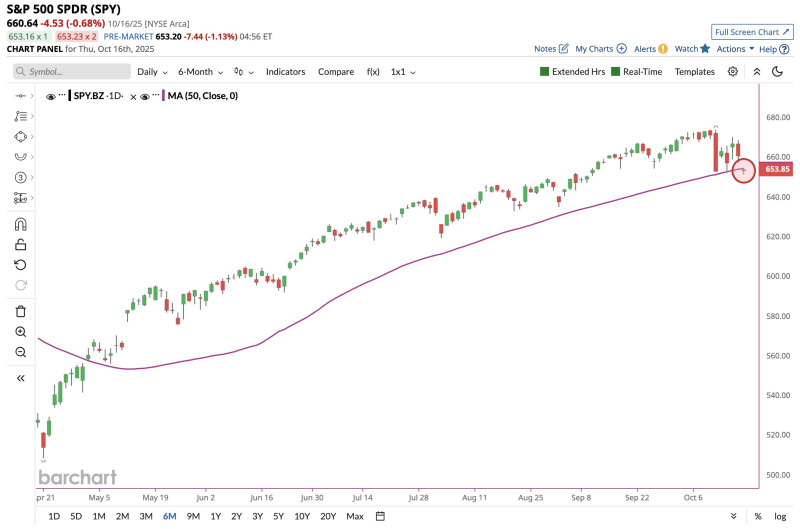
● Why does this matter? When SPY drops below its 50-day average, it often triggers selling from momentum traders and algorithmic systems that rely on technical signals. What starts as a chart pattern can quickly shift market sentiment, creating more volatility.
● The S&P 500 has had a strong run lately, helped by solid earnings and cooling inflation. But losing this technical support could shake investor confidence. Some traders might see this as a buying opportunity, while others worry that continued weakness could put pressure on stock valuations.
● Beyond the trading desks, these technical moves have real-world implications. A sustained pullback could affect retirement accounts, household wealth, and even tax revenues tied to capital gains. On the flip side, a quick rebound would signal that the bull market is still going strong despite the hiccup.
 Marina Lyubimova


