 Marina Lyubimova

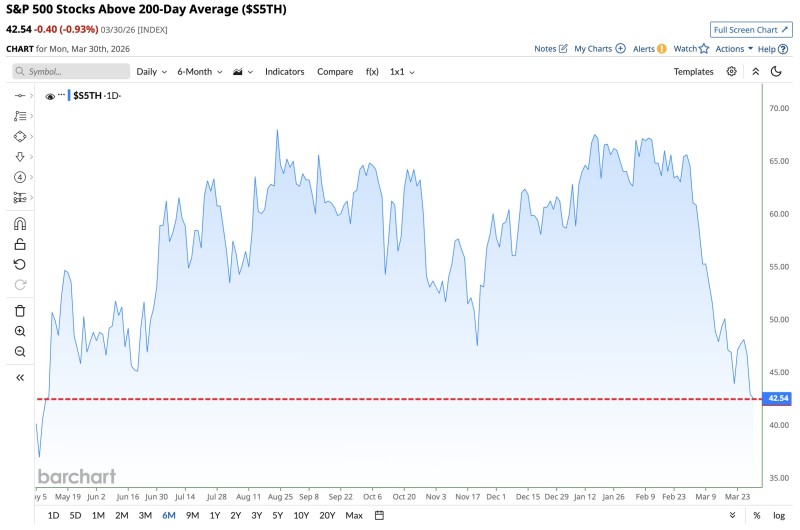
Market breadth across the S&P 500 is deteriorating sharply, with fewer than 43% of stocks trading above their 200-day moving average. According to data shared by Barchart, this marks the weakest participation since May, pointing to growing fragility beneath the surface of the SPY stock trend.
The Internal Weakness Beneath the SPY Surface
The chart tracks the percentage of S&P 500 components holding above their 200-day moving average - a key long-term metric in technical analysis. This indicator reflects how many stocks are actually participating in the broader trend, rather than just the index itself.
Over recent months, the measure fluctuated at higher ranges but has now sharply declined toward 42%, aligning with the lowest levels seen in months. The move is abrupt, not gradual - indicating a rapid loss of participation across the index.
Market breadth indicators are widely used to reveal hidden weakness or strength that may not be visible in headline index performance, where a small number of large-cap stocks can drive overall gains.
A Drop That Signals Narrowing S&P 500 Participation
The move below the 43% threshold reflects a meaningful contraction in participation. Fewer stocks maintaining positions above their 200-day moving average suggests that long-term uptrends are breaking down across a large portion of the market.
This aligns with broader market observations where weakening breadth often precedes more visible index-level weakness. Prior periods of declining participation have coincided with deteriorating sentiment and increased downside risk in the S&P 500 SPY Falls Below 50-Day Moving Average.
For example, prior periods of declining participation have coincided with deteriorating sentiment and increased downside risk in the S&P 500.
A Shift in the Stock Market Trend
The structure of the indicator shows a clear transition from stronger participation toward contraction. The recent drop represents a breakdown in internal strength rather than a stable consolidation.
While the S&P 500 itself may still hold key levels, breadth deterioration suggests the underlying stock market trend is weakening. Historically, this type of divergence - where fewer stocks support the index - has marked periods of instability or transition.
Related market signals reinforce this view. In S&P 500 Enters Bearish Breadth Regime: 5 of 7 Key Indicators Fall Below Critical Threshold, multiple breadth indicators have already shifted into bearish territory, signaling reduced participation across sectors.
The Signal Traders Are Watching Now
With breadth now below 43%, the key question is whether this level stabilizes or continues to decline. Sustained weakness would indicate further erosion in market structure, even if headline indices remain resilient.
Another perspective comes from Just 158 S&P 500 Stocks Beating the Index - Third-Lowest Since 1960, which highlights how gains are increasingly concentrated in a small group of stocks - another sign of narrowing participation.
The S&P 500 may still be holding up on the surface, but beneath it, fewer stocks are carrying the trend - leaving the broader market more vulnerable to shifts in momentum.
For now, the message from the chart is clear: internal market structure is under pressure, and breadth is not confirming the headline index performance. That gap rarely stays open for long.
 Marina Lyubimova


