 Eseandre Mordi

⬤ The S&P 500 has officially entered bearish market breadth territory, with five out of seven critical indicators now trading below their 50-day moving averages. This technical shift represents a significant change in the market's internal health, signaling that fewer stocks are participating in any potential upside movement. The breadth framework tracks participation across major market segments to gauge overall strength beyond just headline index numbers.
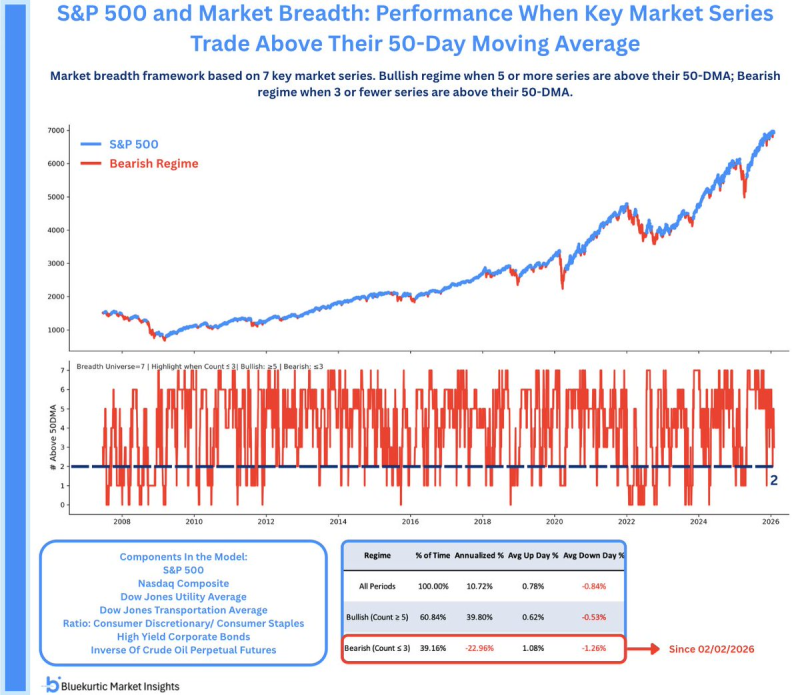
⬤ The seven core indicators monitored include the S&P 500 itself, Nasdaq Composite, Dow Jones Utility Average, Dow Jones Transportation Average, the consumer discretionary-to-staples ratio, high-yield corporate bonds, and the inverse of crude oil futures. A bullish regime exists when at least five series trade above their 50-day averages, while a bearish regime kicks in when three or fewer hold above that line. Right now, the market sits firmly in bearish territory.
⬤ The historical performance gap is striking. During bullish breadth periods, the S&P 500 has posted annualized returns around 39.8%. But when breadth turns bearish, the index has historically declined by roughly 22.96% on an annualized basis. This current bearish phase began in early February 2026, coinciding with noticeably weaker participation even as the index held elevated levels.
⬤ Why does this matter? Because breadth reveals what's happening beneath the surface. When fewer stocks maintain upward momentum, the market becomes more fragile and prone to sudden drawdowns, even if the major indexes look stable. This divergence between headline S&P 500 numbers and deteriorating internal participation signals rising risk conditions. Investors should recognize that reduced breadth typically means the rally is running on fewer cylinders, making it harder to sustain gains and easier for volatility to spike.
 Eseandre Mordi


