 Usman Salis

⬤ Cardano keeps bumping its head against a clear ceiling. ADA's been trading below a resistance zone on the 30-minute chart, hanging around $0.38–$0.39 after an earlier push higher that's now losing steam. The price is basically taking a breather, moving sideways in tighter ranges—exactly what you'd expect during a correction rather than a strong trending move.
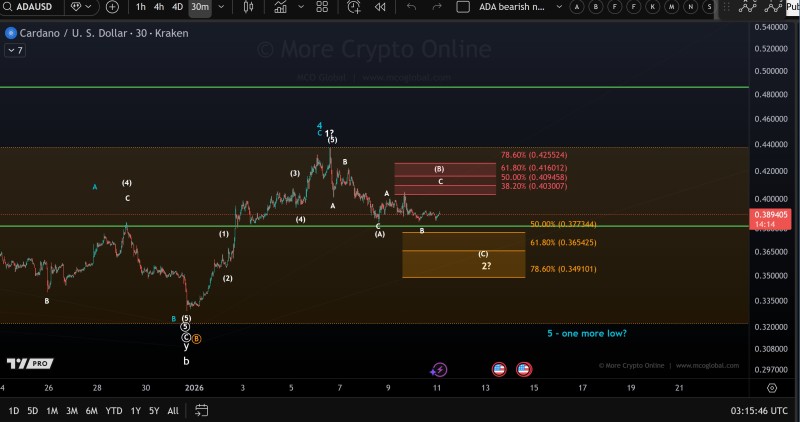
⬤ That resistance zone tied to wave (B) keeps doing its job. Multiple attempts to break higher have failed near the same spot. The chart shows a cluster of Fibonacci levels stacked between $0.40 and $0.42—the 38.2%, 50%, and 61.8% retracements all sitting right there. Every time price approaches this area, sellers show up and push it back down.
⬤ Below current levels, there's a support band around $0.35–$0.37 marked by lower Fibonacci levels and a demand zone. So far, price has respected this floor without breaking through, meaning sellers aren't getting aggressive yet. The Elliott Wave labels suggest we're still working through a corrective phase, with another dip toward support possible if that resistance ceiling continues to hold.
⬤ This matters because Cardano often mirrors broader altcoin sentiment during these consolidation periods. If resistance keeps rejecting price, the corrective structure stays valid. But if ADA manages to push through and hold above $0.40–$0.42, that would shake up the current wave count. For now, it's range-bound trading—traders are watching both ends of this range to see which way the next real move breaks.
 Usman Salis


