 Marina Lyubimova

⬤ Cardano (ADA) is trading near its long-term support area after sliding lower throughout recent months. The weekly chart shows ADA hovering around the $0.39 mark on Binance, with several red candles pushing the price down toward a key support zone. Market observers are watching this level closely, as it represents a potential area for spot accumulation with a longer-term view.
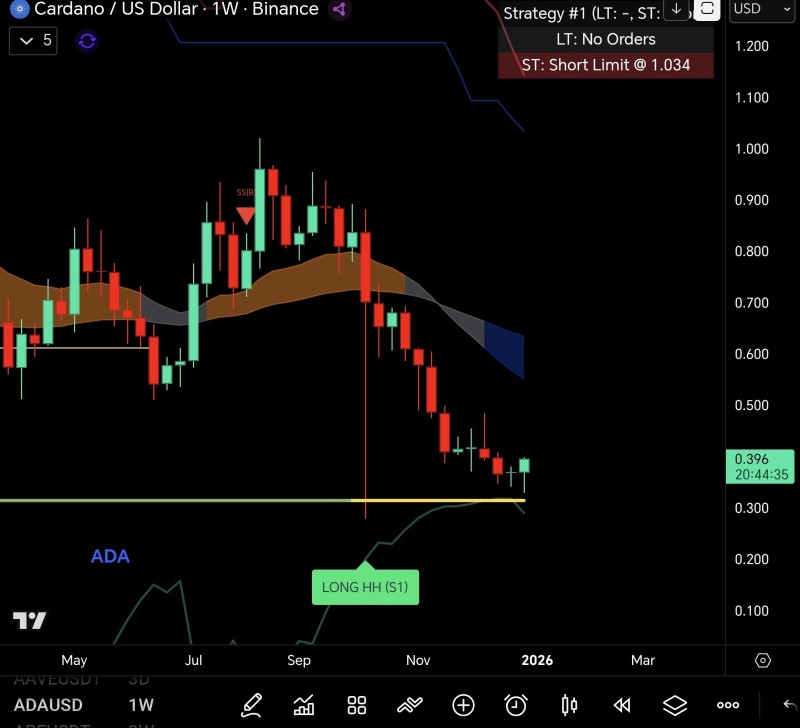
⬤ The price has dropped significantly from levels above $0.70 earlier this year and is now testing support around the $0.33 region marked on the chart. After touching this zone, the current weekly candle has turned green, showing a small recovery attempt from the lows. ADA remains below longer-term resistance levels, with a trend ribbon sitting above the current price action. The chart displays a "LONG HH (S1)" signal near the present price area.
⬤ Trading near this established support zone makes the current level interesting for those with a longer outlook. While the recent bounce suggests some near-term stabilization, ADA is still trading well below its previous highs, keeping the broader downward structure intact on the weekly timeframe. The support area has historically acted as a reaction zone where the price has found it difficult to push lower.
⬤ This matters because Cardano is one of the major altcoins in crypto, and price behavior at multi-month support levels often influences broader sentiment around the asset. If ADA can hold above this support, it could lead to consolidation at lower ranges. A break below this level would signal continued downside pressure and highlight ongoing risk in the longer-term trend.
 Marina Lyubimova


