 Eseandre Mordi

Gold's latest move highlights a precise technical reaction rather than a sustained shift in trend. $Trader noted that price rallied into resistance but was immediately rejected, confirming that sellers continue to defend this level aggressively. The move reflects a classic interaction between short-term momentum and a well-established supply zone.
The Rejection That Defined Gold's Latest Move
On the hourly chart, gold remains in a clear sequence of lower highs, with a descending trendline acting as dynamic resistance throughout March. The latest rally pushed price back toward the $4,750 - $4,800 region, where it met that trendline once again.
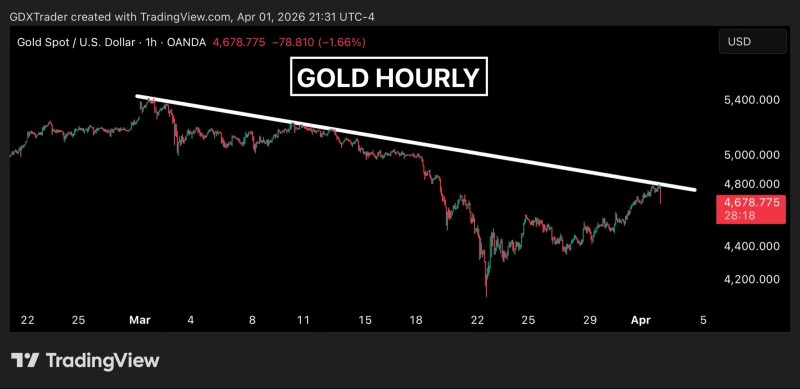
The response was immediate. Instead of breaking through, price printed a sharp rejection and rolled over, signaling that buyers failed to reclaim control. This kind of behavior is typical in trending markets - rallies into resistance tend to attract selling rather than continuation.
Importantly, the rejection occurred precisely at the same descending resistance that has capped multiple attempts over recent weeks, reinforcing it as a dominant technical barrier.
A Structure That Continues to Favor Gold Sellers
The broader structure remains intact and clearly tilted downward. Since early March, gold has consistently formed lower highs, while downside impulses have been stronger and more aggressive than rebounds.
This latest move did not change that pattern - it confirmed it.
- Price failed to break above descending resistance
- The rally stalled below the prior swing high
- Selling pressure emerged exactly at a known supply zone
Every time price pushes up into that zone, it gets absorbed - this isn't a market looking for a breakout, it's a market distributing into strength.
This alignment suggests the market is still respecting technical structure above all else. Even when price pushes higher, those moves are being absorbed by sellers positioned at key levels.
Where the Pressure on Gold Remains Concentrated
The descending resistance line is now the defining feature of the chart. Each test reinforces its importance, as repeated rejections signal that supply remains active in that zone.
Recent price action shows that gold is not breaking out - it is reacting within a controlled structure. Similar setups have been observed in recent market conditions, where gold repeatedly struggled to overcome resistance zones and faced renewed downside pressure afterward, as seen in Gold breaks below $4,450 as selling pressure builds and Gold at $4,100 pivot: breakout or breakdown looms.
The structure is doing the work here - lower highs, aggressive downside impulses, and sellers stepping in every time price approaches the ceiling. That's not noise, that's a trend.
At the same time, gold's interaction with resistance zones continues to define short-term direction, with recent analysis showing price repeatedly testing upper boundaries before being pushed back, as highlighted in Gold tests $4,600 resistance after rebound.
Until price can break and hold above this descending resistance, the pattern of lower highs remains valid. For now, gold is not showing signs of structural reversal - only continued respect for a well-defined ceiling where sellers remain firmly in control.
 Eseandre Mordi


