 Usman Salis

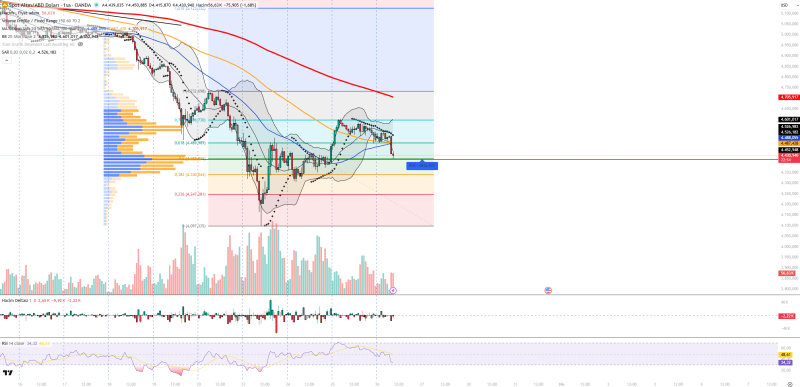
Gold has broken below a key intraday support range, and the charts are starting to tell a pretty clear story. After bouncing sharply from the $4,200 area all the way up to $4,580, price rolled over and slipped beneath the $4,480-$4,550 zone - turning what was a balance area into overhead resistance. As Forex Sinyal Merkezi pointed out, the structure has shifted bearish, with downside levels now coming into focus.
The Breakdown That Shifted Control
The move is textbook. A strong bounce from $4,200 into the $4,580 zone, a rejection, and then a clean breakdown below the $4,480-$4,550 range that had been holding price in check.
That kind of transition matters - when support flips into resistance, it tells you who's in control.
This is not just a pullback. The structure has shifted, and sellers are taking over.
This isn't noise. It lines up with broader patterns seen in gold markets, where rejection at supply zones tends to lead to continuation lower - especially when price stays pinned below key resistance bands. A similar dynamic played out in XAU/USD Gold Price Analysis: $4,570 Support Level Determines Next Move, where holding or losing key levels defined the next directional move.
Momentum Indicators All Point the Same Way
The technical picture isn't mixed - it's pretty one-sided right now. RSI is hovering in the 35-40 range, which signals weak momentum without being deeply oversold. Volume is picking up on sell-side candles, volume delta is staying negative, Bollinger Bands are expanding toward the lower band, and Parabolic SAR has flipped above price.
When volume increases on down candles and RSI stays weak, that's not a setup that resolves to the upside easily.
That kind of indicator alignment doesn't fade quickly - it tends to persist until price finds a real support level to react from. The volume profile adds another layer here: a point of control (POC) sits near $4,412, which acts as a high-liquidity magnet during bearish phases. Price tends to gravitate toward these zones, and this one is squarely in the path of the current decline. This setup mirrors conditions covered in Gold Price Analysis: Bearish Trend Holds Below $5,080-$5,120 Supply Zone, where sellers maintained control as long as price stayed under key supply areas.
Where Price Is Likely Heading Next
With gold now trading below $4,450, the structure maps out a fairly clear path downward. The first reaction zone is $4,410, near that POC cluster. Below that, $4,340 is the next structural support, with $4,250 and $4,200 as broader downside targets if selling pressure continues to build.
A recovery isn't off the table entirely, but it needs to show up fast. A move back above $4,520 would be the minimum required to reopen upside toward $4,580-$4,600. Until that happens, the bias stays lower.
Unless bulls reclaim $4,520 quickly, this chart is pointing at $4,340 and potentially $4,200 as the next real test.
This level-based framework is consistent with how gold has been behaving across timeframes - specific thresholds have been driving directional bias, as seen in Gold Tests $5,000 Support After Retreat from $5,600 Peak. Gold is no longer consolidating. The breakdown below $4,450 confirms a shift in control, and unless price reclaims lost ground in a hurry, the path of least resistance points lower.
 Usman Salis


