 Eseandre Mordi

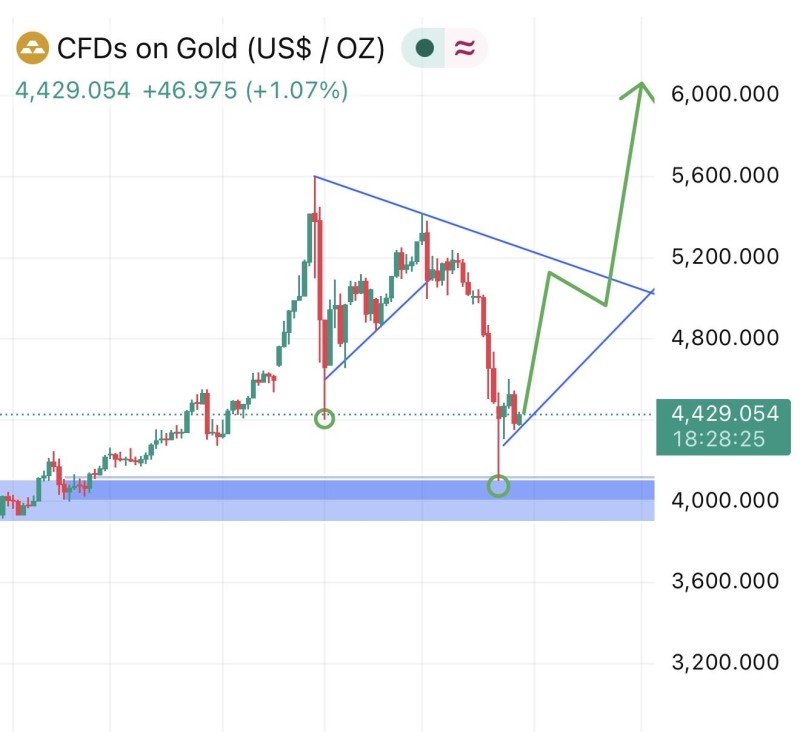
After topping near the $5,400–$5,500 region, XAU/USD failed to hold higher highs and began forming lower highs along a descending resistance line — a clear signal the market had shifted from trend continuation into correction mode. The selloff drove price directly into a strong demand zone near $4,000–$4,100, a level that previously acted as a launchpad during the earlier rally. According to TOP GAINER TODAY, what happens here will likely define the next major leg.
Gold's recent move is not a clean continuation setup — it's a structural reset.
$4,100: The Line That Decides Everything
The $4,100 region isn't just another support level. It marks the base of the previous impulsive rally, a prior consolidation range before breakout, and a liquidity zone where buyers stepped in with conviction. As covered in Gold Price Analysis: 12% Pullback Shows Signs of Stabilizing, similar setups have historically seen markets stall at such structural pivots before choosing direction.
The breakdown that led to this test carried real damage:
- The prior sequence of higher highs has been invalidated
- Price is now respecting a descending trendline
- The latest leg down formed a sharp liquidity sweep into support
If $4,100 holds, the current move could evolve into a higher low within a broader bullish trend. Lose it with a decisive close below, and downside targets open toward $3,800 — and potentially $3,500.
Unlike earlier pullbacks, the current move carries more structural damage. Instead of bouncing quickly, price is consolidating near the lows, suggesting weaker buyer response.
Gold Triangle Compression Points to a Big Move
One of the most telling features on the chart is the emerging triangular compression. Price is now trapped between a descending resistance line from recent highs and a rising short-term support from the latest bounce. That tightening range reflects declining volatility — historically a precursor to a sharp directional expansion. As noted in Gold Price Analysis: Bearish Trend Holds Below $5,080–$5,120 Supply Zone, similar triangle formations in gold have led to fast breakouts once price escapes the structure.
The bullish projection maps out a path to:
- Reclaiming $4,800–$5,000
- Breaking above the descending resistance line
- Extending toward $6,000 in a continuation move
That said, this scenario stays conditional on momentum returning. Without a clean breakout, the structure favors continued pressure on buyers.
Buyers are cautious. Liquidity below support remains at risk. The market has not fully regained bullish control.
Buyers Present — But Not Convincing
The bounce from the $4,000 zone confirms demand exists, but the reaction lacks the urgency you'd expect from a strong uptrend. Typically, key support produces aggressive reversals, expanding volume, and quick reclaims of lost levels. Here, the response has been measured. Gold is still operating within a broader macro uptrend — and as long as price avoids sustained trading below $4,000, the long-term structure holds. But it's clearly weakened in the short term. For longer-term context, Gold Price Prediction: XAU Breakout Could Target $7,000–$8,000 outlines what a full bullish continuation could look like if this zone successfully absorbs selling pressure.
 Eseandre Mordi


