 Marina Lyubimova
Gold is back in focus after staging a sharp recovery from multi-week lows. Having dropped all the way from $4,770 to $4,200, the metal clawed back ground quickly and is now pressing against a critical resistance cluster between $4,530 and $4,600. Whether bulls can clear that ceiling, or get pushed back again, will shape the next leg of the move. This analysis draws on recent technicals and market commentary to lay out what traders should watch.
XAU/USD Gains 8% From Recent Low, Now Facing $4,600 Resistance
Price action on the hourly chart shows XAU/USD rebounding roughly 8% off the $4,200 low to reach $4,570.
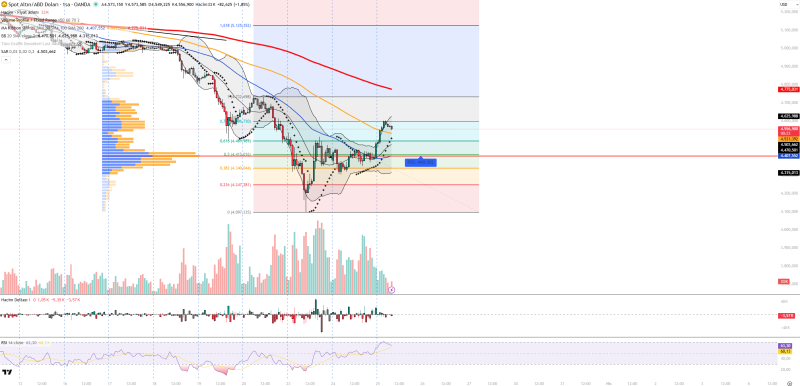
The move has brought gold into the upper Fibonacci zone near 0.786, which lines up directly with the $4,600 barrier analyzed in Gold holds near $4,570-$4,600 range as key levels define direction. A sustained break above $4,600 would put $4,700 and eventually $4,770 back in play. On the downside, losing $4,500 opens the door to $4,430 and $4,380.
RSI Above 60 and Bullish SAR Confirm Short-Term Upside Bias
Technical readings back the recovery. The RSI sits above 60, Bollinger Bands show price trading near the upper band, and Parabolic SAR has flipped bullish. Positive volume delta during the rebound adds further weight to the move. A comparable setup was analyzed in Gold tests $5,000 as $4,800-$4,600 demand zone comes into focus, where strong reactions from support drove similar recovery phases. Volume profile places the point of control near $4,406, reinforcing that level as key underlying support.
The macro backdrop remains mixed for gold. Geopolitical tensions and safe-haven demand keep a floor under prices, while dollar strength and elevated interest rates limit how far the rally can run. As discussed in Gold breaks structure near $4,500 and signals downside risk zones, reactions at key technical levels remain the dominant driver of short-term direction. The $4,600 test may not resolve cleanly, but the bias stays bullish as long as price holds above $4,500.
 Marina Lyubimova


