 Victoria Bazir

Tesla shares have spent the past several sessions finding their footing near the 325-period moving average - a level that is quickly becoming one of the most-watched technical zones on the chart. After a prolonged pullback marked by lower highs, price action is tightening directly on this rising average, and both RSI and MACD are showing early signs that selling pressure may be running out of steam. With $420 now clearly in focus as the next resistance target, the question is whether TSLA can build enough of a base here to support a meaningful recovery.
The Moving Average That Became the Pivot
Tesla shares are attempting to form a base after a sustained pullback, with price action clustering around a rising long-term moving average. According to Banana3, this level is acting as a key point of interest, while momentum indicators hint at a possible rebound toward the $420 resistance area.
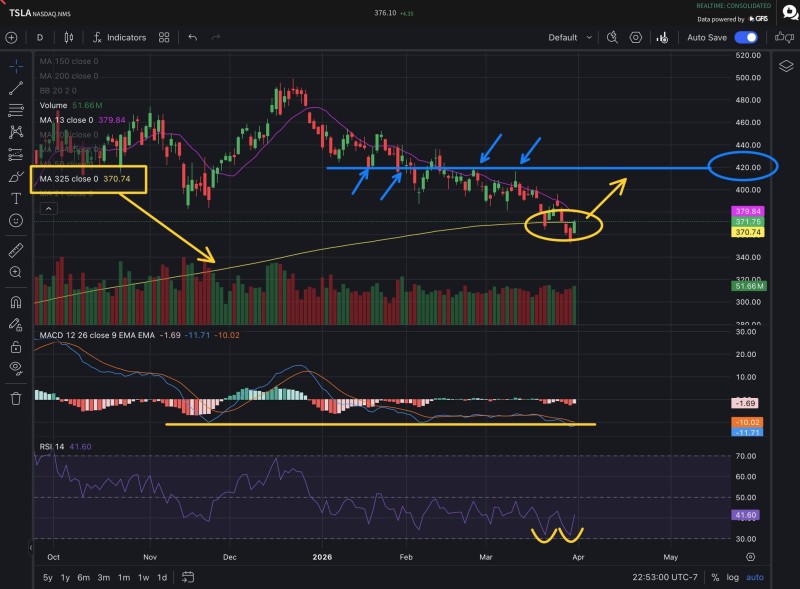
The chart highlights the 325-period moving average as the central level where price has recently found support. After a steady decline marked by lower highs, TSLA has approached this rising average and begun to stabilize.
Price is no longer accelerating downward. Candles are forming tighter ranges directly on the moving average, suggesting that sellers are losing momentum at this level.
This interaction carries real weight. Similar behavior has appeared in recent TSLA technical setups, where holding above key support zones often leads to consolidation before a directional move. Tesla Tests $383 Support With $410 Break Key to Next Move offers additional context on how TSLA has navigated these inflection points.
Momentum Signals Reset at the Lows
The indicators shown on the chart align with the stabilization narrative. The Relative Strength Index has formed a double bottom near the lower band, indicating that downside momentum has been exhausted.
The MACD has reset near its previous support area rather than extending further into negative territory - a cooling of bearish pressure rather than continuation.
At the same time, the MACD has reset near its previous support area rather than extending further into negative territory. This combination reflects a cooling of bearish pressure rather than a continuation of the downtrend.
Together, these signals support the idea that price is no longer in an aggressive downtrend phase, but transitioning into a potential base-building structure. Traders watching TSLA Stock Tests Key $420-$425 Zone as Head-and-Shoulders Pattern Emerges will recognize this zone as one that has repeatedly shaped near-term direction.
TSLA Eyes the $420 Barrier as the Next Key Level
The next key area sits near $420, marked on the chart as a prior support/resistance flip zone. This level has previously acted as both support and resistance, making it a natural target if price begins to move higher.
For that scenario to develop, several conditions need to hold:
- Price must maintain footing above the 325-period moving average
- Higher lows need to continue forming on the shorter timeframes
- Bearish pressure must stay subdued as confirmed by RSI and MACD readings
Failure to hold the moving average would keep the broader sequence of lower highs intact and delay any meaningful recovery attempt.
Reclaiming resistance zones in the $410-$420 range can shift short-term momentum and open the door for further upside.
Recent market structure across TSLA confirms that the $410-$420 range has repeatedly defined short-term direction. TSLA Price Analysis: Tesla Eyes Break Above 421 Toward 427 breaks down how price has interacted with this cluster in prior sessions.
A Base Before the Next Move
TSLA stock remains in a transitional phase. The downtrend structure has not yet been fully reversed, but the current price behavior suggests that selling pressure is weakening at a critical technical level.
The combination of support at the 325 moving average, RSI stabilization, and MACD reset points to a market that is no longer trending lower aggressively - one that appears to be preparing for its next directional move. With $420 now emerging as the defining level, the coming sessions will likely determine whether recovery gains real traction or the broader downtrend reasserts itself.
 Victoria Bazir


