 Saad Ullah

⬤ Tesla stock is sitting at a make-or-break technical spot right now. A head-and-shoulders pattern has formed on the 2-hour chart, and TSLA is testing a rising trendline that's been holding things together. The chart shows two clear drops that have left the stock in what traders are calling a 50/50 setup—it could go either way from here.
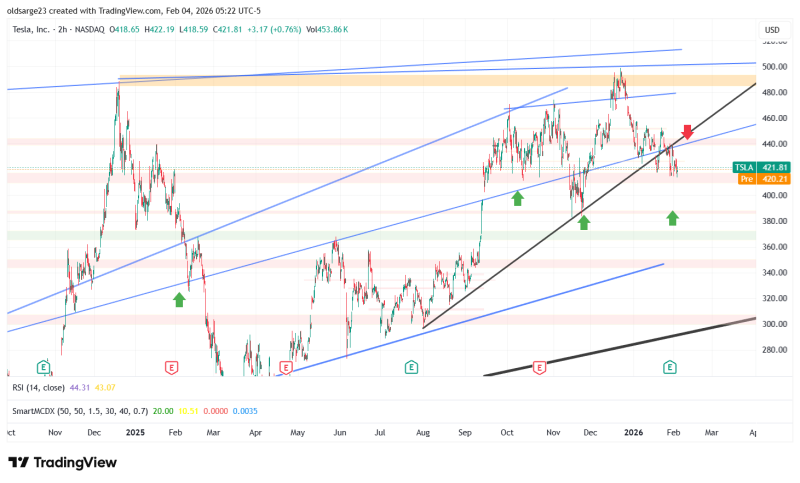
⬤ Price recently pulled back from higher ground and is now trading around the $420–$425 zone. The right shoulder is clearly visible on the chart, with TSLA slipping below recent resistance but still hanging onto that main uptrend line. It hasn't broken down yet, but it's also lost that earlier bullish push.
⬤ The momentum picture backs up this neutral stance. "The stock is positioned at a key inflection area where the next directional move may shape short-term sentiment," as one analyst noted. The RSI on the 2-hour sits near the middle—no strong buying or selling pressure pushing things one way or the other. Zoom out a bit and Tesla's still inside a larger rising channel, even though the short-term action is testing support.
⬤ What happens next at this trendline matters. If TSLA holds above it, the broader uptrend stays intact and bulls keep control. Break below it decisively, though, and sellers could start eyeing lower support levels on the chart. With momentum flat and price sitting right at this inflection point, the stock's next move will likely set the tone for volatility in the sessions ahead.
 Saad Ullah


